









Validation
How diagnostics are graded, where they appear, what stops a diagram building, and how to turn advisories off.
Three severities
| Severity | Meaning |
|---|---|
| Error | The data or the model breaks a rule. Most errors leave the diagram drawn, so the problem can be seen. |
| Warning | The model is usable but may not say what was intended. |
| Information | A note about the model, such as a rule that could not be checked. |
What stops a diagram building
A missing required mapping stops the diagram being built, and the Validation tab says Graph generation is blocked until the required data and mappings are corrected. When the layout cannot be calculated, the mapped graph remains available for inspection.
Rule errors in the method itself, such as a gate with too few inputs or a threat with no path to the top event, do not stop the diagram drawing.
Where diagnostics appear
- The editor header shows the number of errors, or if there are none, the number of warnings. Validation clear means there are no errors or warnings; information notes do not change it.
- The Validation tab label counts every diagnostic, information notes included.
- Selecting the status in the header opens the Validation tab.
The Validation tab
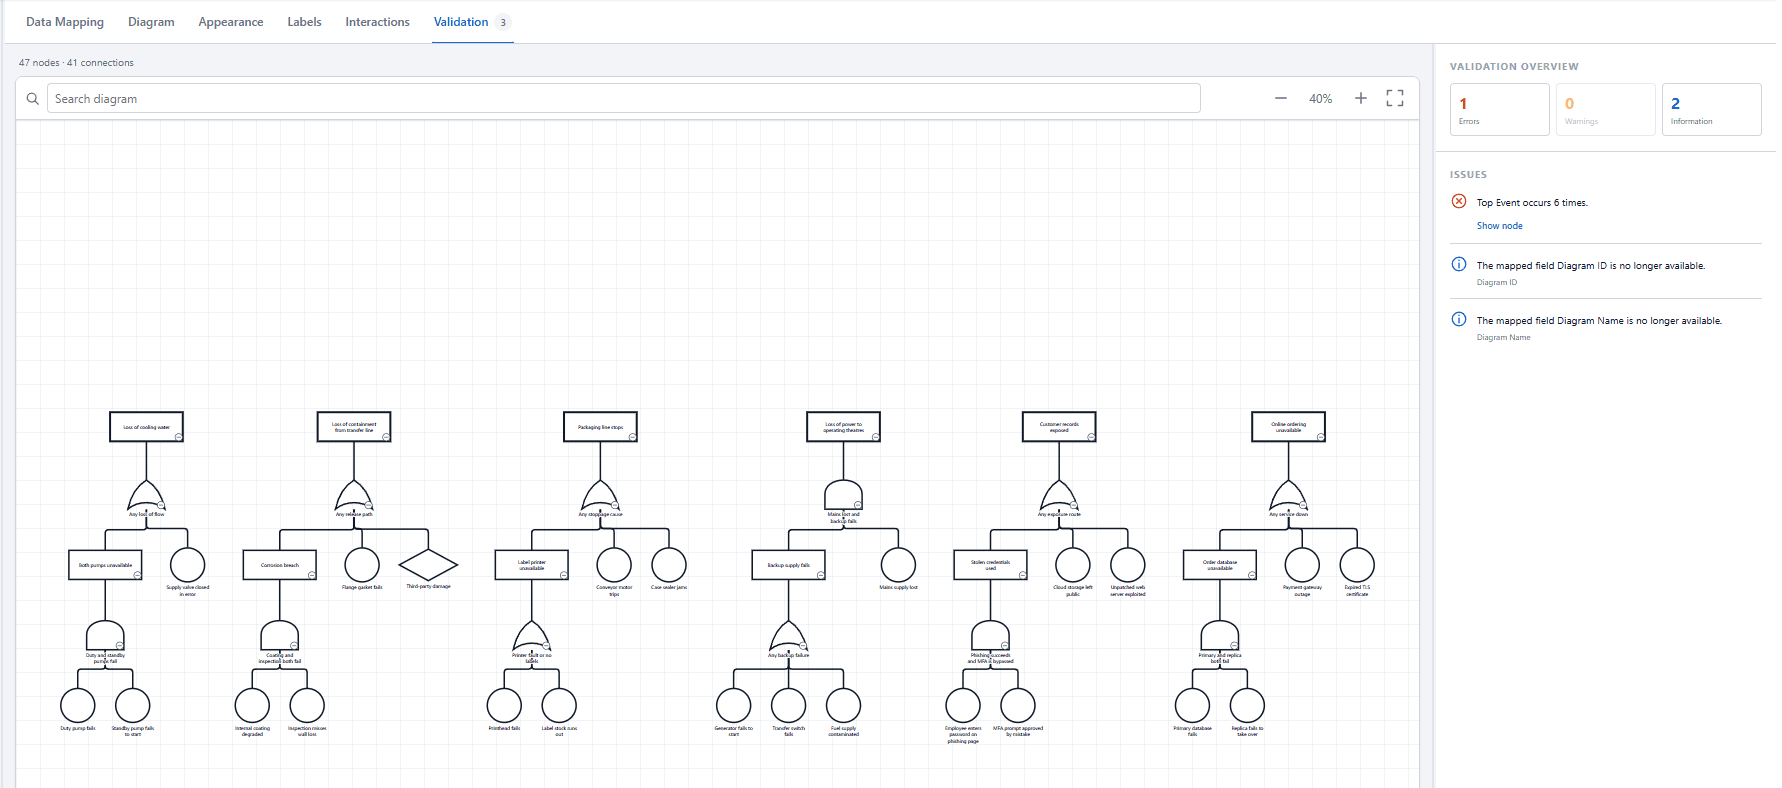
Validation overview shows a card each for Errors, Warnings and Information. Select a card to list only that severity, and select it again to list everything.
Issues lists each diagnostic, errors first, with the source rows it came from. Where a diagnostic concerns a node, Show node moves the preview to that node.
Advisory diagnostics
Fault Tree Analysis, Bow-Tie Risk Analysis and Event Tree Analysis raise advisories: non-blocking guidance about a model that is valid but may be incomplete. To turn them off, set Advisory diagnostics to Hide advisories on the Diagram tab. On a fault tree the setting is in the Dynamic gate conventions group; on a bow-tie and an event tree it is in the Validation group.
| Diagram type | Advisories cover |
|---|---|
| Fault Tree Analysis | Repeated events, non-coherent gates, degenerate voting thresholds, unused dormancy factors and spare-mode conflicts. |
| Bow-Tie Risk Analysis | Barriers with no recorded state, and lanes whose order is ambiguous. |
| Event Tree Analysis | A missing initiating frequency, and sequences that cannot yet be quantified. |