









Introduction to Ataytis Assurance
What Ataytis Assurance is, the six diagram types it draws and what each is used for, what a diagram needs from your data, and where to start.
What is Ataytis Assurance?
Ataytis Assurance is a Power BI custom visual that draws fault trees, bow-ties, event trees, reliability block diagrams, goal structures and Markov state diagrams from the rows of a table. One visual is installed; the diagram type is a setting inside it.
Nothing is drawn by hand. Each row names a node and the node it connects to. The visual builds the diagram, checks it against the rules of the method, and lays it out automatically. When a slicer or filter changes the rows, the diagram is rebuilt from the rows that remain.
Most of these methods come from safety and reliability engineering, but the diagrams are used far more widely: to show what can take an IT service down, which equipment a production line depends on, how the claim that a product meets a requirement is supported, or how anything moves between states. The sample report built with the visual covers digital infrastructure, energy, healthcare and manufacturing.
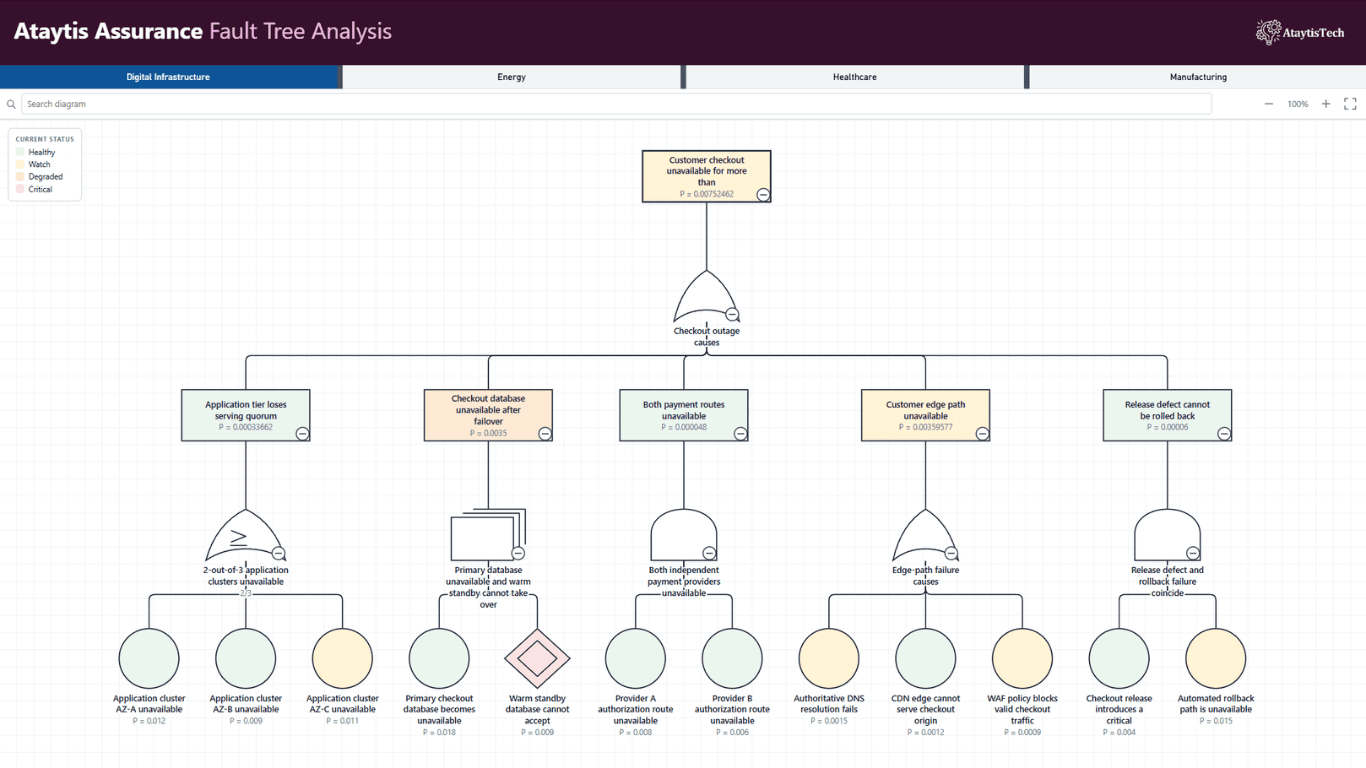
The six diagram types
| Diagram type | What it shows |
|---|---|
| Fault Tree Analysis | How an unwanted event can happen, broken down through AND, OR and other gates into the causes behind it. |
| Bow-Tie Risk Analysis | One unwanted event in the centre, what can cause it on the left, what can follow it on the right, and the barriers or controls on each side. |
| Event Tree Analysis | What can follow a starting event as each safeguard, system or action works or fails, out to every outcome. |
| Reliability Block Diagram | Which parts must keep working for a system to work, in series, in parallel or m-out-of-n. |
| Goal Structuring Notation | An argument that a claim holds, broken down through strategies to solutions that reference the evidence for it, with its context. |
| Markov State Diagram | The states a system or process can be in and the rates at which it moves between them, repairs included. |
Notation standards
Five of the six diagram types offer a notation profile designed with reference to a published standard or handbook. Bow-Tie Risk Analysis has none, because no publication defines bow-tie symbols.
| Diagram type | Profiles | New diagrams use |
|---|---|---|
| Fault Tree Analysis | IEC 61025:2006, Traditional / NUREG-0492, Custom | IEC 61025:2006 |
| Bow-Tie Risk Analysis | None | — |
| Event Tree Analysis | IEC 62502:2010, Custom | Custom |
| Reliability Block Diagram | IEC 61078:2016, Custom | Custom |
| Goal Structuring Notation | GSN Community Standard v3, Custom | GSN Community Standard v3 |
| Markov State Diagram | IEC 61165:2006, Custom | IEC 61165:2006 |
Standards in many industries describe how to carry out these analyses, or what a safety case must contain, without prescribing how the diagram must look. The visual draws the analysis from the data you give it, so work done to any of them can be built and presented with it too.
| Standard | Area | What it describes | Draw it with |
|---|---|---|---|
| IEC 31010:2019, Risk management – Risk assessment techniques | Risk management | Bow tie analysis, event tree analysis, fault tree analysis and Markov analysis, among other risk assessment techniques | Bow-Tie Risk Analysis, Event Tree Analysis, Fault Tree Analysis, Markov State Diagram |
| IEC 60300-3-1:2003, Dependability management – Analysis techniques for dependability – Guide on methodology | Dependability | Fault tree, event tree, reliability block diagram and Markov analysis, among other dependability analysis techniques | Fault Tree Analysis, Event Tree Analysis, Reliability Block Diagram, Markov State Diagram |
| IEC 62740:2015, Root cause analysis (RCA) | Root cause analysis | The fault tree method, as one of its root cause analysis techniques | Fault Tree Analysis |
| IEC 61508-6:2010, Functional safety of electrical/electronic/programmable electronic safety-related systems – Part 6: Guidelines on the application of IEC 61508-2 and IEC 61508-3 | Functional safety | Reliability block diagrams, fault trees and Markov models for evaluating probabilities of hardware failure (Annex B) | Reliability Block Diagram, Fault Tree Analysis, Markov State Diagram |
| IEC 61511-3:2016, Functional safety – Safety instrumented systems for the process industry sector – Part 3: Guidance for the determination of the required safety integrity levels | Process industry | Event tree analysis as a semi-quantitative method (Annex B), with fault trees in its worked examples | Event Tree Analysis, Fault Tree Analysis |
| SAE ARP4761A:2023, Guidelines for Conducting the Safety Assessment Process on Civil Aircraft, Systems, and Equipment | Aerospace | Fault tree analysis, dependence diagrams and Markov analysis, among other safety assessment methods | Fault Tree Analysis, Reliability Block Diagram (dependence diagrams), Markov State Diagram |
| ISO 26262-10:2018, Road vehicles – Functional safety – Part 10: Guidelines on ISO 26262 | Automotive | Fault tree construction and applications (Annex A), and understanding safety cases | Fault Tree Analysis, Goal Structuring Notation |
| MIL-STD-882E, Department of Defense Standard Practice: System Safety | Defence | Fault tree analysis, as one of the analytical techniques a hazard management plan can name | Fault Tree Analysis |
| ISO/TR 24971:2020, Medical devices – Guidance on the application of ISO 14971 | Medical devices | Fault tree analysis and event tree analysis, among the techniques that support risk analysis (Annex B) | Fault Tree Analysis, Event Tree Analysis |
| EN 50126-2:2017, Railway applications – The specification and demonstration of Reliability, Availability, Maintainability and Safety (RAMS) – Part 2: Systems approach to safety | Rail | Techniques for safety analysis (Annex F), naming fault tree, event tree and reliability block diagram analysis; hazards pictured as a bow tie; safety cases | Fault Tree Analysis, Event Tree Analysis, Reliability Block Diagram, Bow-Tie Risk Analysis, Goal Structuring Notation |
| ECSS-Q-ST-40-12C, Space product assurance – Fault tree analysis – Adoption notice ECSS/IEC 61025 | Space | Fault tree analysis on space projects, adopting IEC 61025 | Fault Tree Analysis |
| ISO/IEC/IEEE 15026-2:2022, Systems and software engineering – Systems and software assurance – Part 2: Assurance case | Assurance cases | The structure of an assurance case: claims supported by argument and evidence, with no required notation | Goal Structuring Notation |
| UL 4600, Edition 3 (2023), Standard for Safety for the Evaluation of Autonomous Products | Autonomous products | A safety case: a structured argument, supported by evidence, that an autonomous product is safe | Goal Structuring Notation |
Whichever standard you work to, the analysis is yours: the visual draws what your data holds and checks its structure against the rules of the method. It does not assess whether an analysis meets a standard.
What a diagram needs
A diagram is built from a Node ID on every row and a Connected node naming the node that row links to. A Node type column says what each node is, which decides its symbol and which of the method's rules apply. The table shows the mappings each diagram type requires before it will build.
| Diagram type | Required mappings |
|---|---|
| Fault Tree Analysis | Node ID |
| Bow-Tie Risk Analysis | Node ID and Node type, or the register columns Threat, Barrier and Consequence |
| Event Tree Analysis | Node ID, Node type, Relationship type |
| Reliability Block Diagram | Node ID |
| Goal Structuring Notation | Node ID, Node type, Relationship type |
| Markov State Diagram | Node ID |
Where the settings live
The visual's settings are not in the Power BI format pane. Diagram type, field mapping, notation, layout, appearance, labels and interactions are all configured in the advanced editor: select the visual, open More options (…) and choose Edit. The configuration is saved inside the report.
Words used in this manual
| Word | Meaning |
|---|---|
| Node | A box, circle or other symbol on the diagram: an event, a gate, a barrier, a block, a goal or a state. |
| Connection | A line between two nodes. |
| Node ID | The ID that names a node: a number such as 4, or a code such as G1 or PMP-A. Every row carries one. |
| Connected node | The Node ID at the other end of a row's connection. |
| Node type | What a node is, such as OR Gate, Threat or Goal. It decides the symbol and the rules that are checked. |
| Relationship type | What a connection means, where the method has more than one kind, such as InContextOf in a goal structure or Repair in a Markov model. |
| Role | A job the visual needs a column for, such as Node ID or Probability. Each diagram type has its own list. |
| Mapping | Telling the visual which of your columns does which role. Most columns are mapped by their name; the rest are chosen on the Data Mapping tab. |
| Field well | One of the three boxes in the Visualizations pane that columns are dropped into: Data fields, Values and Tooltips. |
| Diagram ID | A column that keeps several diagrams apart when one table holds them all. |
Where to start
Install the visual
Getting the visual and building with it in Power BI Desktop is free. A licence is only needed when a report is published to the Power BI Service for others to open. Get and install the visual covers both.
Draw a first diagram from four rows
Build your first diagram types a small table into Power BI and turns it into a fault tree, so you see every step once.
Bring in the data you already have
If it lives in Visio, a spreadsheet, a database or another tool, or is simply a list of items and the items they belong to, Bring in your own diagram shows how to turn it into rows and load it.
Follow the pages for your diagram type
Each diagram type has a Preparing data page with the columns it reads, which row each value goes on and a complete example.