









Preparing Markov data
The table a Markov diagram needs: one row per transition from the state it leaves to the state it reaches, which row each value goes on, the columns and what to call them, and a complete worked example.
One row per transition
Each row is a transition: the state it leaves in State ID, the state it reaches in Connected State ID, and its rate. A state with three transitions leaving it has three rows.
Every state needs a row of its own. A state nothing leaves, such as an absorbing state, has one row with Connected State ID left blank. Without that row, the state is not drawn, the transition into it is dropped, and the Validation tab reports A relationship references a node that is not present.
Transition Type, Transition Rate, Transition Label and Relationship ID on a row describe that row's transition. Everything else on the row describes the state it leaves, so give every row of a state the same state values: label, identifier, probability, status and flags.
Columns
| Column | Maps to | Well | Fill it in on |
|---|---|---|---|
| State ID | Node ID | Data fields | Every row: the state the transition leaves. |
| Connected State ID | Connected node | Data fields | Every row except a state nothing leaves: the state the transition reaches. |
| Node Type | Node type | Data fields | Every row. Optional; without it every state is a plain state. |
| State Label | Label | Data fields | Every row: what the state means. |
| State Identifier | State identifier | Data fields | Optional. The short name drawn in the symbol, such as 0 or 1A. Falls back to the State ID. |
| Transition Type | Relationship type | Data fields | Transition rows: Failure, Repair or Transition. |
| Transition Label | Relationship label | Data fields | Optional. Words for the arrow, such as Pump fails. |
| Transition Rate | Transition rate | Values | Transition rows. |
| State Probability | State probability | Values | Every row of a state, when you have it. |
| Status | Status | Data fields | Every row of a state, for colouring and the summary strip. |
| Relationship ID | Transition ID | Data fields | Optional. An identifier for each transition. |
| Diagram ID | Diagram ID | Data fields | Every row, when the table holds more than one model. |
| Diagram Name | Diagram name | Data fields | Every row, for a readable name in the diagram picker. |
Only Node ID has to be mapped. The flag columns a register often keeps beside its states, for absorbing and initial states, a state class and a count of failed elements, are covered on States and transitions.
Other column names that bind
| Role | Also recognised |
|---|---|
| Node ID | State ID, State Code, From State, From State ID, and the names every diagram type uses |
| Connected node | Connected State ID, Connected State, To State, To State ID, Next State, Next State ID, Successor State |
| Label | State Label, Label, Description |
| State identifier | State Identifier, Identifier, Display ID, Tag |
| Relationship type | Transition Type, Relationship Type |
| Relationship label | Transition Label, Relationship Label |
| Transition rate | Transition Rate, Rate, Transition Intensity, Intensity, Rate per Hour, Rate per Year, Rate per Unit Time, Transition Rate per Hour, Transition Rate per Year, Transition Rate per Million Hours |
| State probability | State Probability, Probability, Steady State Probability, State Prob, Occupancy, Occupancy Probability, Current State Probability, Current Probability |
| Transition ID | Relationship ID, Edge ID, Link ID, Connection ID, Relation ID, Rel ID |
If the diagram shows states and no arrows, the connection column has not bound. Name it Connected State ID, To State or Next State, or map it to Connected node by hand.
A complete example
Two duty pumps: both available, one failed, both failed, and a casing rupture the system cannot recover from. Each failure has a repair back, apart from the rupture. It validates with no errors, warnings or notes. Transition Rate and State Probability are in Values, set to Don't summarize. Cells with no value are left blank.
| State ID | Connected State ID | Node Type | State Label | State Identifier | Transition Type | Transition Rate | State Probability | Status |
|---|---|---|---|---|---|---|---|---|
| S0 | S1 | Initial State | Both pumps available | 0 | Failure | 0.0002 | 0.9978 | Healthy |
| S1 | S0 | Degraded State | One pump failed | 1 | Repair | 0.125 | 0.0016 | Degraded |
| S1 | S2 | Degraded State | One pump failed | 1 | Failure | 0.0001 | 0.0016 | Degraded |
| S2 | S1 | Failed State | Both pumps failed | 2 | Repair | 0.0625 | 0.0005 | Failed |
| S2 | S3 | Failed State | Both pumps failed | 2 | Failure | 0.00001 | 0.0005 | Failed |
| S3 | Absorbing State | Pump casing ruptured | 3 | 0.0001 | Failed |
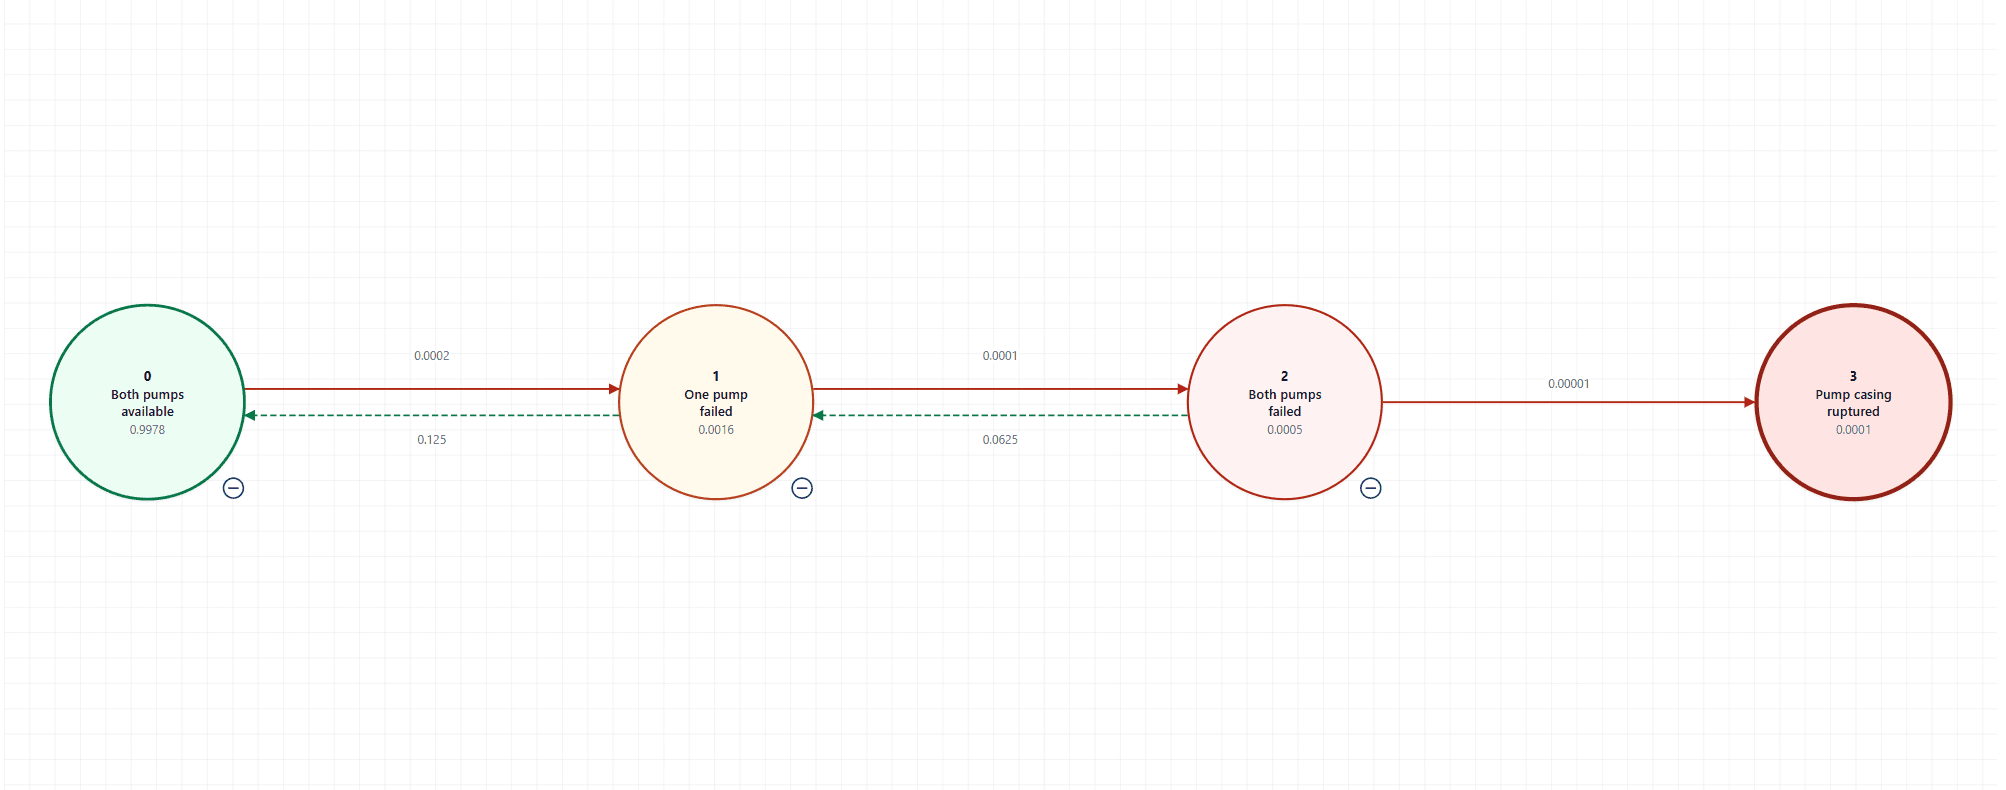
The states run from S0 on the left to S3 on the right. Each arrow carries its rate, because the table has no transition label, and each state has its probability beneath it. S1 and S2 each have two rows, one per transition leaving them, with the same state values on both.
If your table names the state a transition comes from
Some tables give each row the state reached and name the state it came from. For those, set Data Mapping → Connection column → Reads as to Connected node comes before this row.
Left on the default, every arrow points the wrong way, and because loops are allowed the diagram says little about it. The clearest signs are an absorbing state reported with An absorbing state is one the system cannot leave, but a transition leaves this one., and a state reported as unreachable.
Checks before binding the table
- Trim State ID and Connected State ID. An identifier that differs only by a space does not join.
- Give every state a row, including an absorbing state nothing leaves.
- Give every row of a state the same label, identifier, probability, status and flags.
- Type the transitions Failure or Repair, or the states with Node Type. Without either, the layout has to guess which way the model runs.
- List each transition once. Two rows for the same two states in the same direction with the same type are drawn as one arrow.
- Give every transition a rate, or none of them.
- Set Transition Rate and State Probability to Don't summarize, and give them a Power BI format if you want percentages or fixed decimals on the diagram.