









Multiple diagrams in one table
How a register holding several analyses is split by Diagram ID, how the visual chooses one to draw, and how report readers switch between them.
Diagram ID
One table often holds many diagrams: every analysis for a site, a system or a product. Map a Diagram ID column and each value becomes a separate diagram. One diagram is drawn at a time.
Which diagram opens
With no choice made, the visual opens the diagram whose node types the selected diagram type recognises. A table holding a bow-tie and a fault tree opens the fault tree in Fault Tree Analysis even when the bow-tie's identifier sorts first, with or without a Diagram type column.
When nothing distinguishes the diagrams, the first identifier in sort order opens, and the same one opens on every refresh.
Choosing a diagram
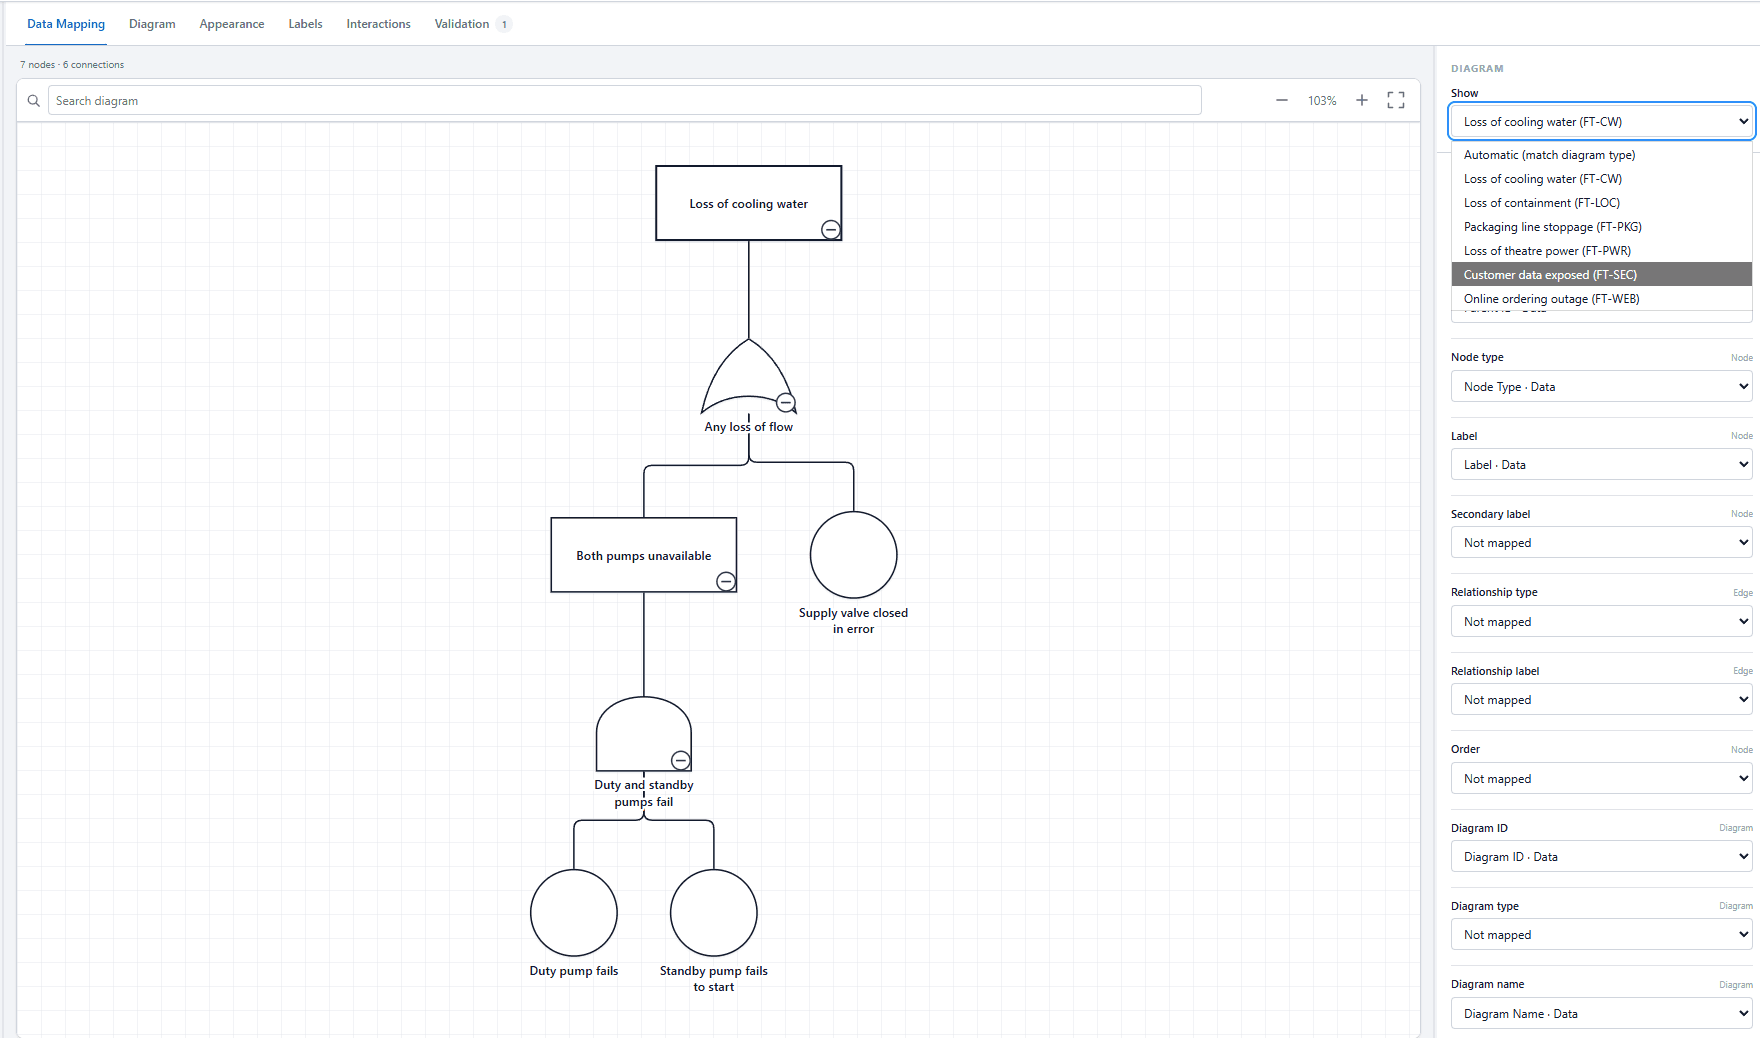
When the table holds two or more Diagram IDs, Data Mapping shows a Diagram group with a Show dropdown. Automatic (match diagram type) is the behaviour described above. Choosing an identifier fixes the diagram.
The dropdown lists only the diagrams the selected diagram type can read, meaning those where at least half of the node types are recognised. If none qualify, every diagram is listed. Map Diagram name and each entry reads as the name followed by the identifier, such as Loss of containment (FT-LOC).
If a chosen identifier is no longer in the data, the automatic choice is used instead of drawing nothing.
Letting readers switch
The choice in Data Mapping is the author's. To let report readers switch diagram themselves, turn on Interactions → Diagram selector → Show selector. It places a dropdown on the report in the corner you choose. The selector is off by default.
Under Names shown to readers, give each identifier a readable name without changing the data. The same group sets the selector's Label, Text size (8–22 px) and Maximum width (120–480 px), and whether it has a Background, Border and Shadow.