









Selecting a node
What clicking a node does: selection and cross-filtering, the Node Inspector and each of its sections, moving between related nodes, Focus branch, tooltips and the right-click menu.
What a click does
- Selects every row behind the node in Power BI, which cross-filters the other visuals on the page.
- Opens the Node Inspector on the node, or moves it to the node if it is already open.
- Ctrl-click adds the node to the selection.
- Selecting empty canvas clears the selection, closes the Node Inspector and clears any focus.
- Selecting a connector selects the rows behind that connection. The Node Inspector stays as it is.
| Setting on the Interactions tab | When turned off |
|---|---|
| Power BI interactions → Selection and cross-filtering | Clicking a node does nothing, and the Node Inspector does not open. |
| Node Inspector → Open on node selection | A click selects the node without opening the Node Inspector. |
| Node Inspector → Node Inspector | There is no Node Inspector. |
The Node Inspector
The Node Inspector shows the data the visual already holds for the node. It never queries the model, so it can only show columns bound to the visual. On a visual at least 720 px wide it opens beside the diagram; on a narrower one it opens over the diagram.
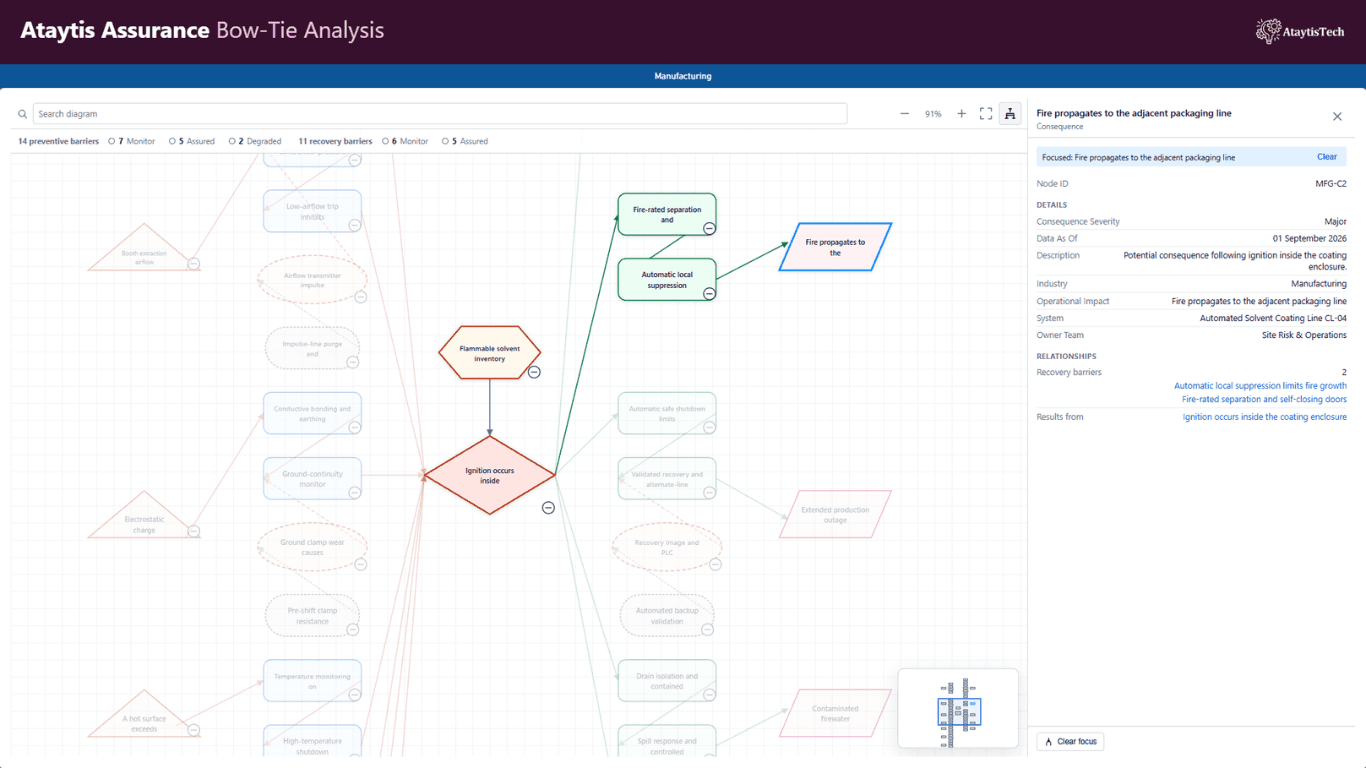
| Part | Shows | Turned off with |
|---|---|---|
| Title | The node's label, with its node type underneath. | Show node type hides the type. |
| Node ID | The node's identifier. | Show Node ID |
| Analysis, Barrier condition or Argument state | Columns mapped to the diagram type's value roles, such as Probability, Status or Health. The heading is Barrier condition on a bow-tie, Argument state on GSN and Analysis on the others. | Show analysis, Show barrier condition or Show argument state |
| Metrics | Columns in Values that are not mapped to a role. | Show bound Values |
| Details | Columns in Data fields that are not mapped to a role, and columns in Tooltips. | Show additional attributes |
| Relationships | The nodes related to this one, in the method's own terms. | Show relationships |
| Focus branch | A button at the foot of the panel. | Focus branch action |
These settings are in the Node Inspector group on the Interactions tab. Values use the Power BI format of their column. Empty values and empty sections are left out, and columns used for structure, such as Connected node or Label, are not repeated.
Under Inspector headings, give any section your own heading: Metrics can become Engineering, or Details can become Asset record. Leave a box blank to keep the default. Under Inspector fields, hide or reorder single fields. Only those choices are saved in the report, never the values.
Names under Relationships are links. Selecting one moves the diagram to that node, selects it and shows it in the Inspector. Where several nodes are related, the row gives the count followed by their names.
A fault tree transfer shows Open linked diagram instead, which opens the diagram the transfer points to. When that diagram is not in the table, the row says Linked diagram unavailable.
Web links
A column whose Data category is Web URL is shown in the Inspector as a link, and selecting it opens the address through Power BI. Only addresses beginning https:// become links. Setting the data category is covered in Dates, numbers and links.
Focus branch
Focus branch, at the foot of the Inspector, keeps the node and the nodes related to it prominent and fades the rest. A bar at the top of the Inspector then reads Focused: and the node's label, with Clear, and the button becomes Clear focus.
Focus is not a filter and is not saved. Selecting empty canvas clears it. What counts as related depends on the diagram type:
| Diagram type | Stays prominent |
|---|---|
| Fault Tree Analysis | The branch that develops the node, and its path up to the top event. |
| Bow-Tie Risk Analysis | The paths the node is on, with the top event and the hazard. See Reading a bow-tie. |
| Event Tree Analysis | The node, everything after it, and its path back to the initiating event. |
| Reliability Block Diagram | The block, every block before it and every block after it. |
| Goal Structuring Notation | The element, everything it leads to including its contexts, and its path up to the top goal. |
| Markov State Diagram | The state, every state it can reach and every state that can reach it. Where repairs loop back, that is usually the whole model. |
Tooltips
Hovering a node shows a Power BI tooltip. It lists the label, the type, the Node ID when it differs from the label, the columns mapped to the diagram type's value roles, then other columns in Values, then columns in Tooltips. Empty values are left out, values use their Power BI format, and at most 20 lines are shown.
A report page can be used as the tooltip instead: the node passes the identity of every row behind it, so the tooltip page is filtered to that node. Tooltips are turned off under Interactions → Power BI interactions → Tooltips.
The right-click menu
Right-click a node for Power BI's own context menu, which is where Drill through appears. The visual first selects every row behind the node, so drillthrough and the other menu items act on the whole node rather than on one of its rows. Right-clicking empty canvas opens Power BI's menu for the visual itself.
To drill through to a page keyed by asset, bind the asset column to Data fields. It needs no mapping. Use the same column as the drillthrough field on the target page. A node with no value in that column offers no drillthrough target.