









Bow-Tie Risk Analysis
What the bow-tie diagram type draws, the two table shapes it reads, what it does not calculate, the standards that describe it, and its defaults.
What it draws
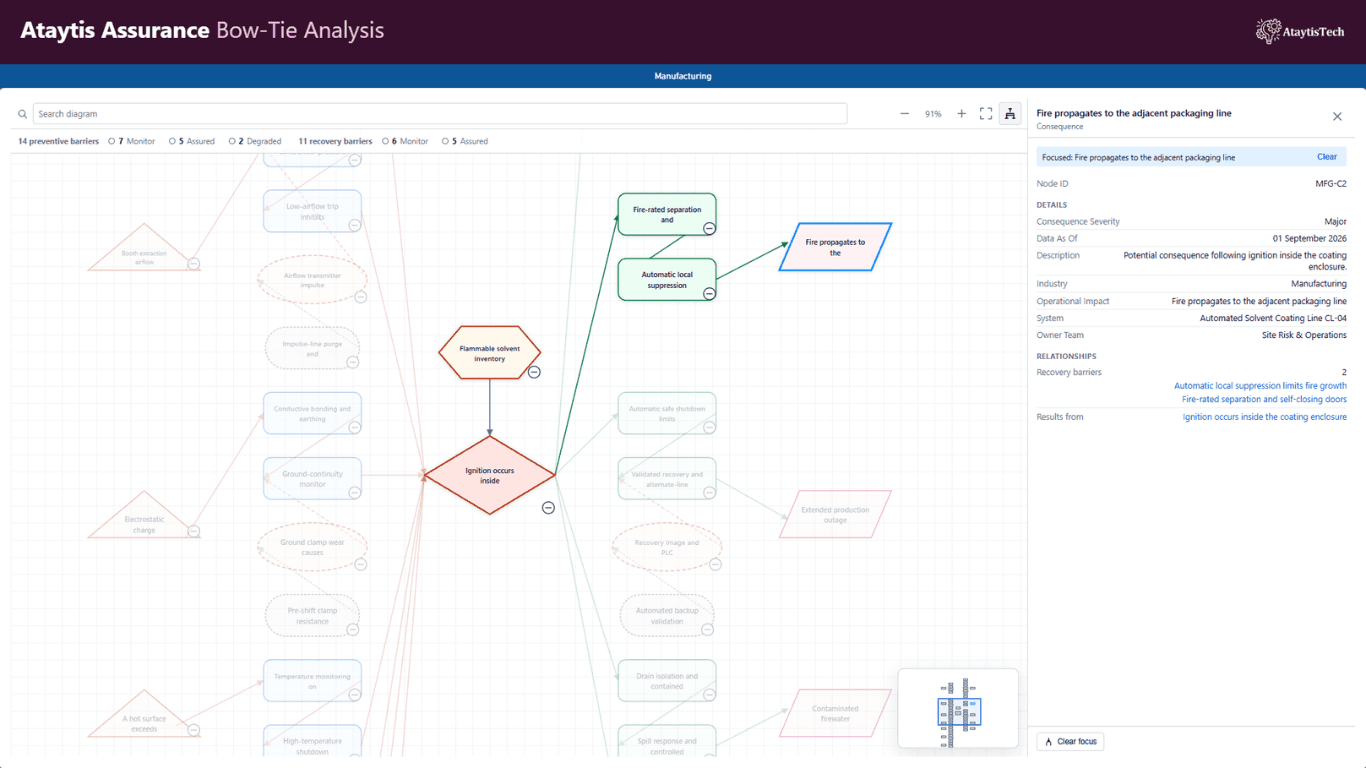
Bow-Tie Risk Analysis draws one top event in the centre: the point where control of a hazard is lost. The hazard sits above it. Threats that can cause the top event are on the left, with the preventive barriers that stop each threat between it and the top event. Consequences that can follow are on the right, with the recovery barriers that limit each one.
Each threat and each consequence has a row of its own, so every path reads straight across. Escalation factors, which weaken a barrier, are drawn beside that barrier's path together with the controls that manage them.
The hazard can be anything that has to be kept under control, so the same diagram is used for process safety, operational, cybersecurity and project risks. Barriers are whatever stands in the way: equipment, procedures, people or software controls.
Two table shapes
| Shape | Each row is | Use it when |
|---|---|---|
| Edge list | One connection: a node and the node it leads to. | You want a hazard on the diagram, your own node IDs, or separate values on threats, consequences and escalation controls. |
| Register | One barrier, with the threat or consequence it belongs to and the top event. | Your data is already a barrier register, and the values you want to show belong to the barriers. |
When Node ID is mapped, the table is read as an edge list. When Node ID is not mapped and Threat, Barrier or Consequence is, it is read as a register.
What it calculates
Nothing. Status, health, effectiveness and any other barrier measure are shown as your data supplies them. The visual does not calculate barrier effectiveness, risk reduction or residual risk.
Standards
No publication defines bow-tie symbols, so a bow-tie has no notation profile. IEC 31010:2019 includes bow-tie analysis among its techniques for analysing controls, with an example diagram but no set of symbols, and EN 50126-2:2017 pictures a hazard, its causes and the accidents it can lead to as a bow tie. Notation standards lists what each one covers.
Defaults
| Setting | Default |
|---|---|
| Notation profile | None. No publication defines bow-tie symbols. |
| Orientation | Left to right. Right to left, top to bottom and bottom to top are also available. |
| Connected node is read as | The node this row leads to |
| Node type when the cell is blank | Threat |
| Relationship type when the cell is blank | Leads to |
| Connector routing | Straight |
| Escalation branches | Show |
| Advisory diagnostics | Show advisories |
| Summary strip | Off. When turned on, it counts preventive and recovery barriers by Status. |