











Ataytis Matrix
The standard matrix runs out of road quickly. This one keeps going — through deep hierarchies, a thousand columns, calculated rows you write yourself, and formatting control that reaches every individual row and column.
30-day free trial. Licensed and billed through Microsoft Marketplace.
Sample report
Same visual, four different looks
Four report pages, all driven by the same visual with nothing but formatting between them. Expand the hierarchies, search, and sort — it behaves the same way in your own report.
Export is switched off in this embedded copy.
A toolbar you decide the shape of
Every button is optional. Resize them, reorder them, restyle them, or take them away entirely — you publish the report with exactly the tools your audience should have, and nothing they should not.
Write your own rows and columns
The calculations view lets you add a row or column and define it with a formula, right in the visual. Sum a handful of line items, derive a ratio, hide the workings, and order the result however you like — no model changes, no new measures, no waiting on someone else.
A thousand columns, still usable
A column per day for a whole year, scrolled end to end without the visual falling over. Rendering is virtualised, row headers stay pinned, and you choose how many cells load at a time.
Expand across, not just down
Column hierarchies expand and collapse like row hierarchies do, with your own expansion symbols and a starting level you set. Sticky headers and grand totals keep their place while you move around.
Export that survives the round trip
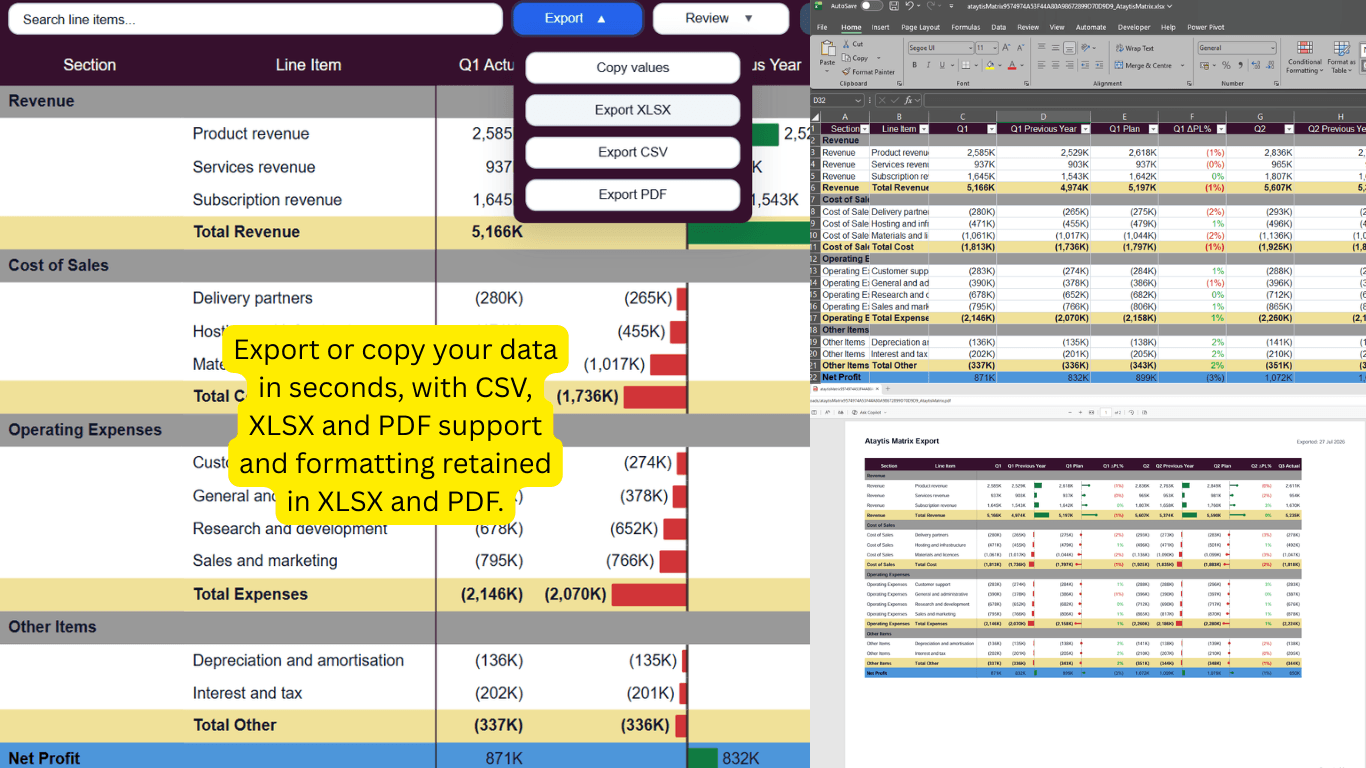
PDF exports take a title, your logo, optional page numbers and a date stamp, and you set how many cells go out in one pass. What lands in Excel is a formatted report rather than a raw dump someone has to rebuild.
Somewhere to put the explanation
A comments panel, a free-text notes column, cell highlighting, and freehand annotation that works in the Power BI Service. The reason behind a number lives next to the number, instead of in an email nobody can find later.
Comparisons without the DAX
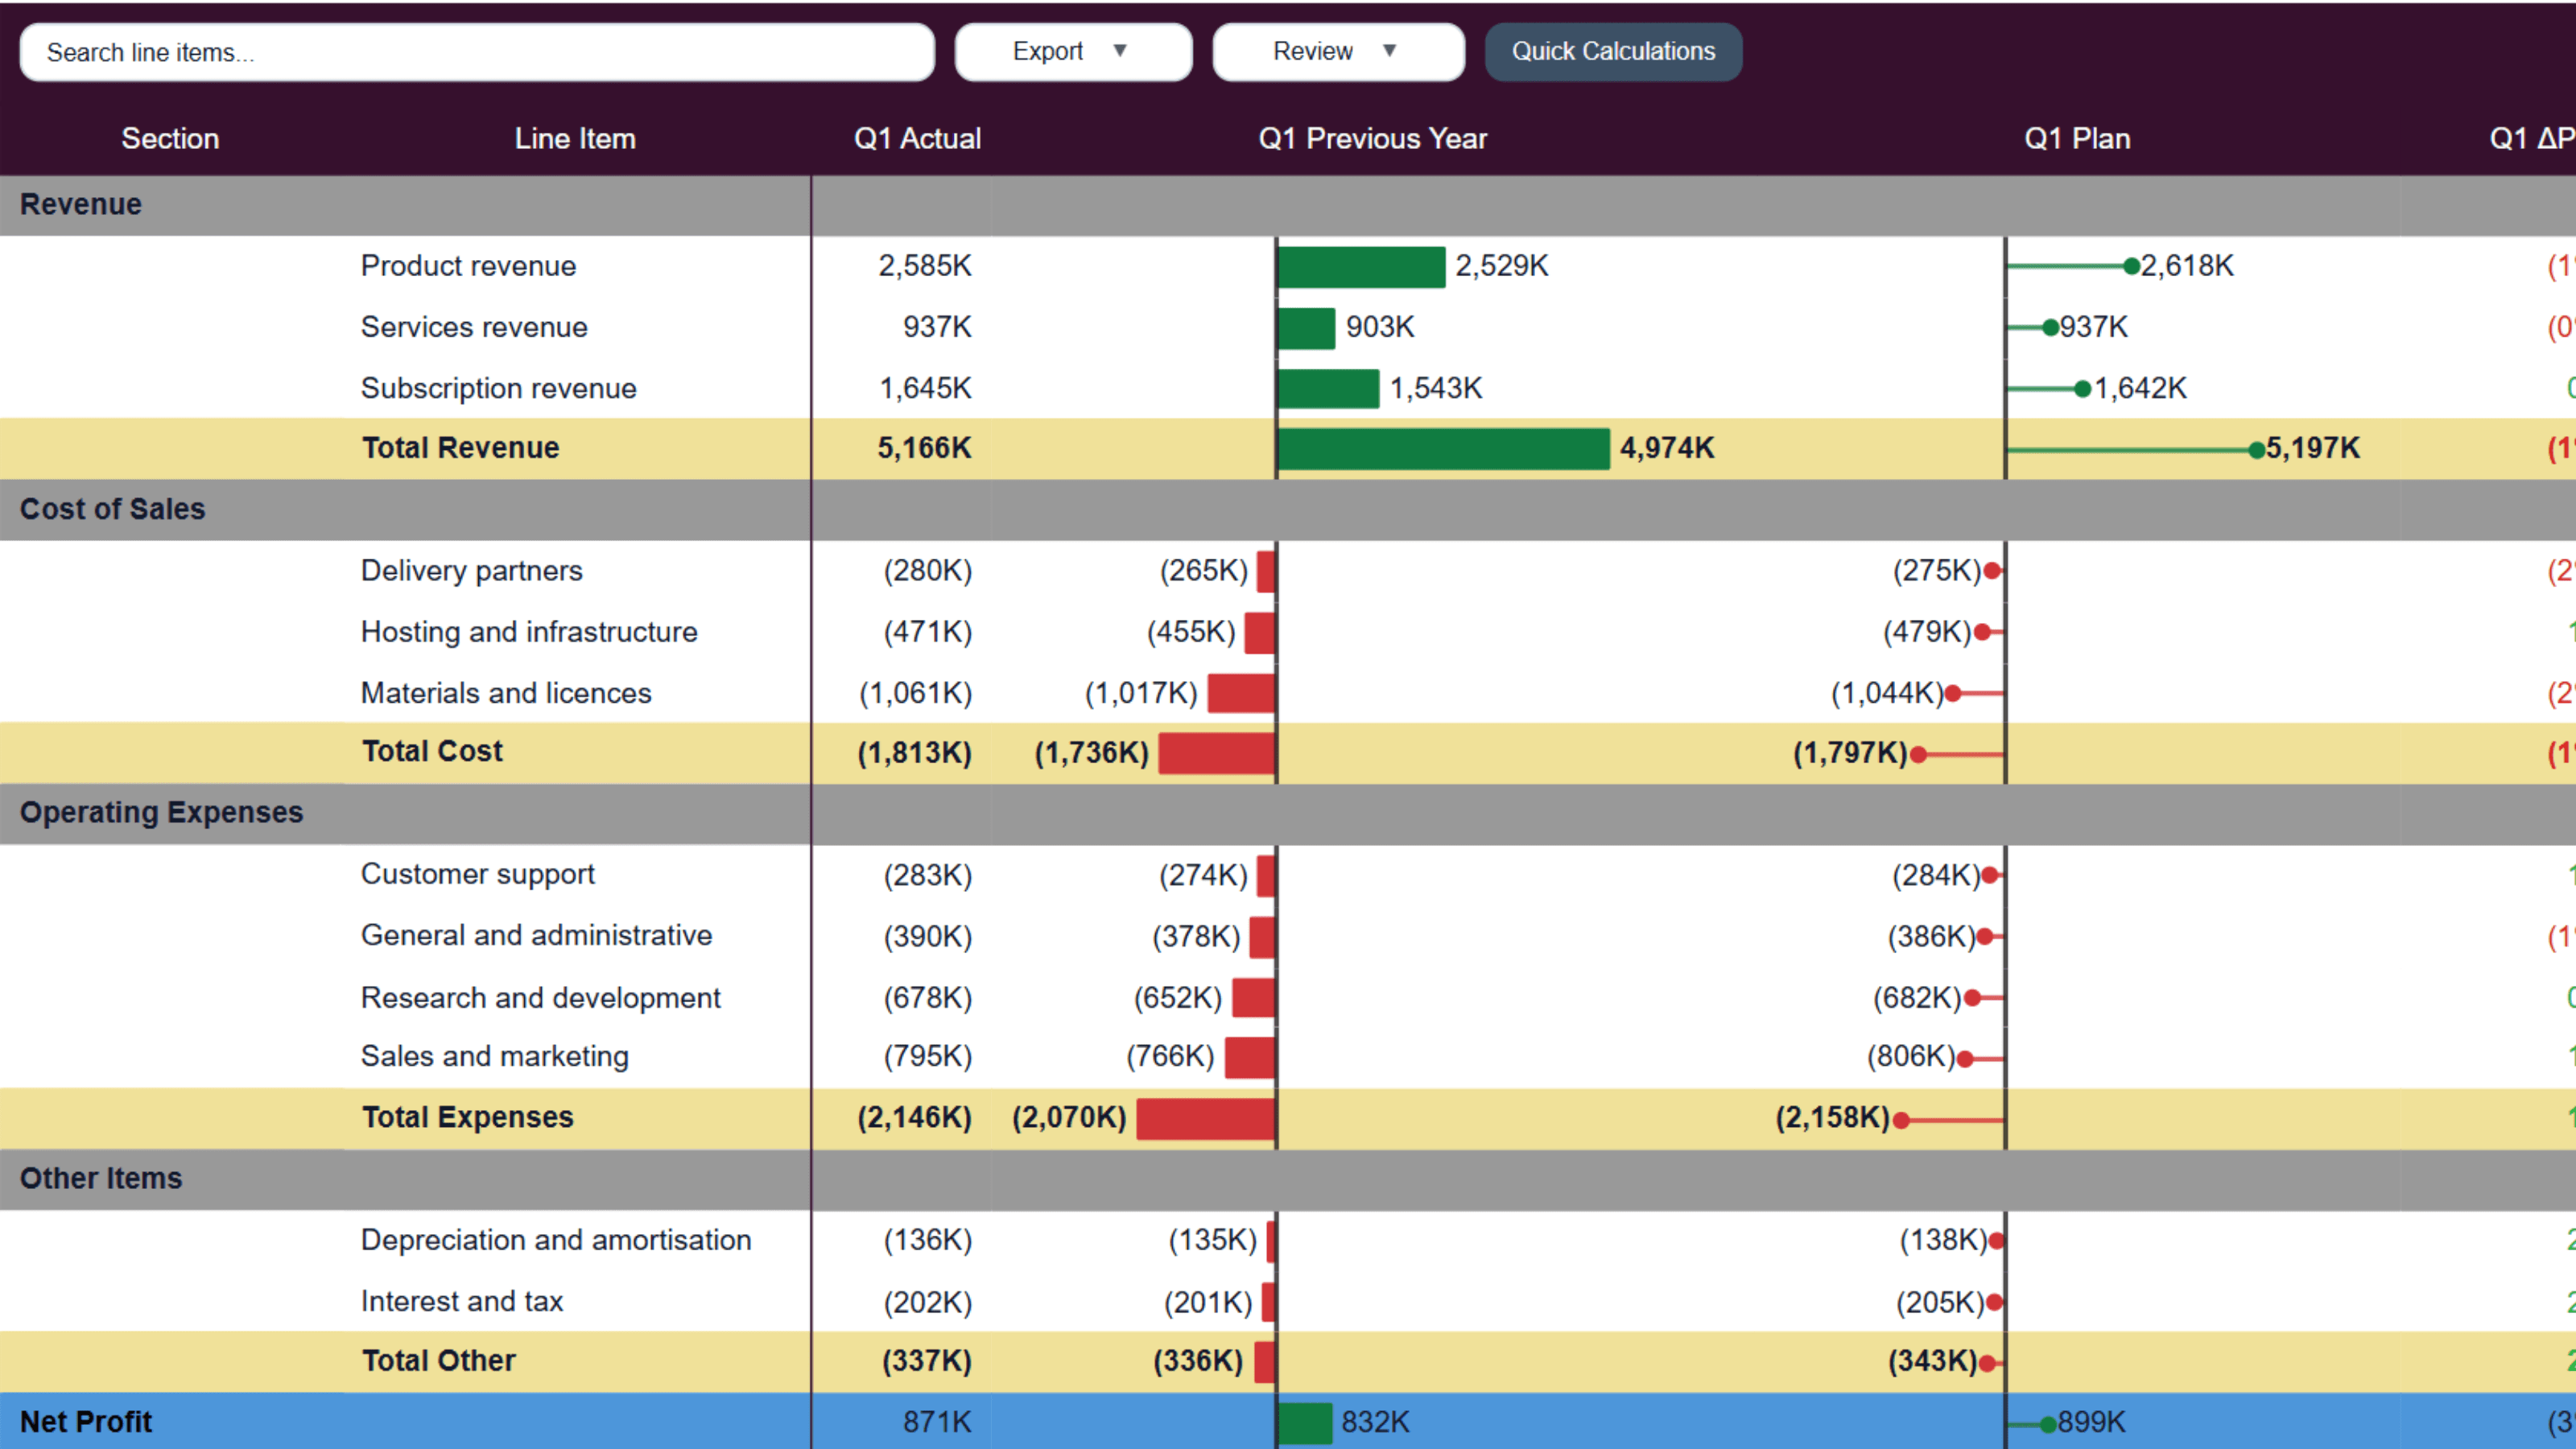
Previous Year, Plan, and Forecast each get their own field well. Drop a measure in and the variance columns, in-cell bars, and target markers follow — nothing to rewrite when someone asks for the same view against budget instead.
Why it is different
Built to sit in a real report
Not a widget bolted onto the page — a visual that reads your data, follows your styling, and answers to your filters.
Try It Without Signing Up
Install it in Power BI Desktop and start building immediately — no trial to start, no form to fill in, and no account with us at all. The visual runs against your own model, watermarked, so you can find out how it handles your real tables before anyone has asked you for an email address. A licence is only needed once the report is published to the Service for other people to read.
Every row and column, individually
Decimals, percentages, inverted signs, borders, weight, alignment — set per row and per column, not just per table.
Calculated rows and columns
Add your own, define them with a formula, hide the ones you were only working through.
Comparison built in
Previous Year, Plan, and Forecast field wells turn any measure into a variance view.
Richer sparklines
A wider set of in-cell chart types than the native matrix offers, sitting alongside the numbers.
Conditional formatting with your own SVGs
Rules can place your own icons in a cell, not only the handful Power BI ships with.
Sorting on your terms
Fully custom column ordering, value-column and grand-total sorting, and top or bottom N with an "Other" bucket.
Layouts that fit the report
Switch row layouts, put values across columns or down rows, and auto-expand to the level you choose.
Stays put while you scroll
Optional sticky row headers, sticky columns, and sticky row and column grand totals.
Certified and self-contained
Passed Microsoft review, makes no external calls, and honours the report author settings for interaction.
Getting started
From install to published report
Install once, then it is there every time you build a report.
Install from Marketplace
In Power BI Desktop, open Get more visuals, search for Ataytis Matrix, and add it. Once per machine.
Start building
No sign-up, no trial, no form. The visual works in Desktop straight away, with a watermark on the preview.
Drop in your fields
Rows, columns, and values as usual — plus Previous Year, Plan, or Forecast if you want the comparison columns.
Licence it to publish
A licence is only needed once the report goes to the Service for other people to read. Thirty days free, billed by Microsoft.
Pricing
Priced per user, with volume discounts
Every person who creates, views, or interacts with a report containing Ataytis Matrix needs a licence. The first month is free on every plan.
Up to 20 users
matrix-pro (1-20)
Monthly$4.99per user
Annual$49.99per user
Up to 100 users
matrix-pro (21-100)
Monthly$3.99per user
Annual$39.99per user
Up to 200 users
matrix-pro (101-200)
Monthly$3.49per user
Annual$34.99per user
Up to 500 users
matrix-pro (201-500)
Monthly$2.99per user
Annual$29.99per user
500 users or more
matrix-pro 500+
Monthly$2.49per user
Annual$24.99per user
Organisation-wide licensing, site-wide licensing, and custom volume discounts are available — ask for a tailored quote.
Prices are per user, in US dollars, purchased and billed by Microsoft through Marketplace rather than through AtaytisTech. Paying annually works out at roughly two months free against the monthly rate.
Questions
Frequently asked questions
Certified, and ready for your next report
Start the 30-day trial and point it at your own model. If it does not handle your tables better than what you have now, you have lost nothing.