









Ataytis Assurance
Choosing a diagram type
What each of the six diagram types is for, how each is laid out, and what the visual calculates.
Six methods in one visual
Choose the diagram type in the Diagram type list on the left of the advanced editor. The data cannot make the choice, although the visual says when your node types match a different type better than the one selected.
| Diagram type | Use it to show | Often used for | Default layout |
|---|---|---|---|
| Fault Tree Analysis | How a top event can occur, through AND, OR, voting and other gates down to basic events. | The causes of a safety incident, a service outage, a product defect or a security breach. | Hierarchy, top to bottom |
| Bow-Tie Risk Analysis | The threats that can lead to one unwanted event, the consequences that can follow it, and the barriers on each side. | Process safety, operational, cybersecurity and project risks, and the controls a risk register holds. | Centred on the top event |
| Event Tree Analysis | The sequences that follow an initiating event as each function succeeds or fails. | What follows a trip, a release, a power loss or a failover, and how often each outcome is expected. | Branching, left to right |
| Reliability Block Diagram | Which combinations of components keep a system working: in series, in parallel and m-out-of-n. | Redundancy in plant and utility systems, IT and data centre infrastructure, and production lines. | Network, left to right |
| Goal Structuring Notation | A structured argument that a claim holds, from goals through strategies to solutions that reference evidence, with its context. | Safety cases, security and compliance arguments, software assurance and certification evidence. | Hierarchy, top to bottom |
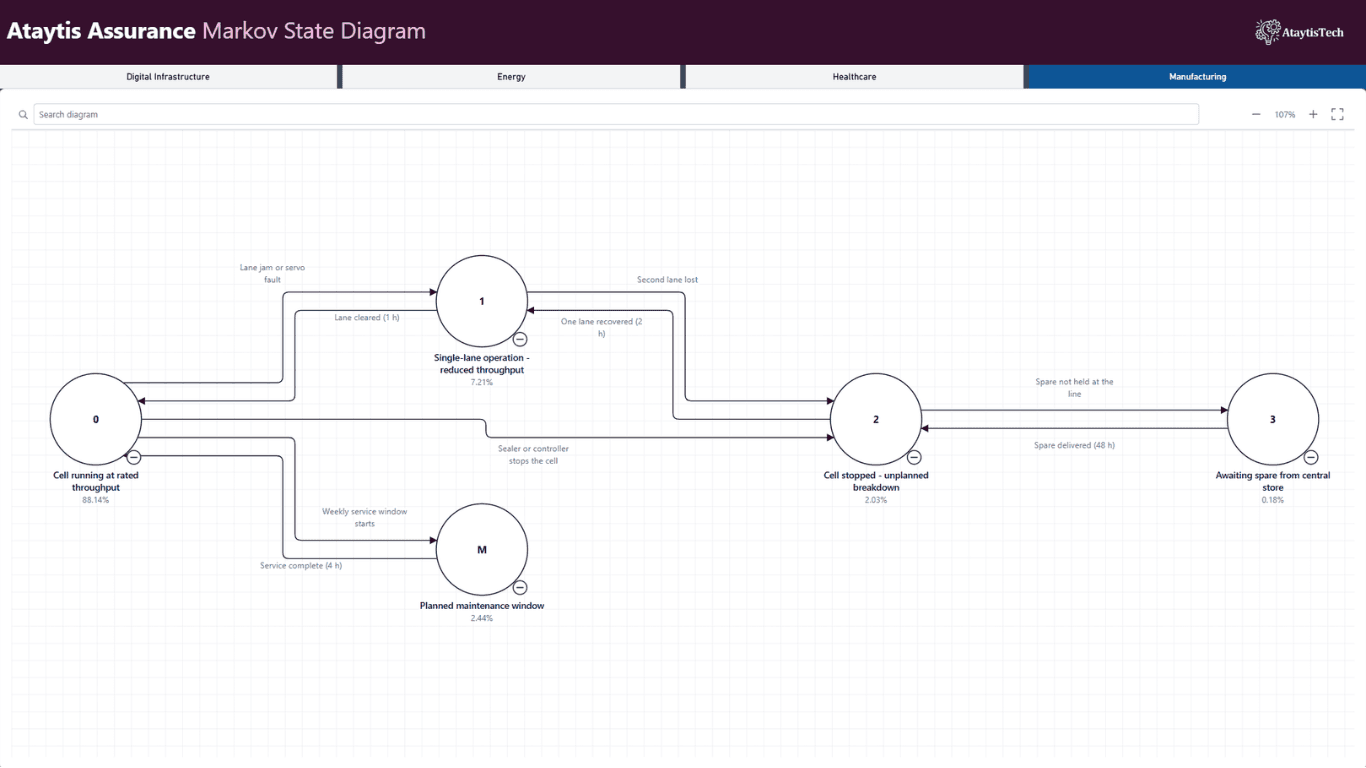
| Markov State Diagram | The states a system or process can be in and the rates at which it moves between them, such as failure and repair. | Availability of repairable equipment and standby systems, and any process described as states and transitions. | State network, left to right |
What is calculated
The visual displays and checks the numbers in your data. It calculates only where a method has one agreed arithmetic.
| Diagram type | Calculated | Not calculated |
|---|---|---|
| Fault Tree Analysis | Nothing. | Top-event probability, minimal cut sets and importance measures. Failure rate, repair rate and mission time are never converted into a probability. |
| Bow-Tie Risk Analysis | Nothing. | Barrier effectiveness, risk reduction and residual risk. Supply the measure your organisation uses. |
| Event Tree Analysis | Sequence identifiers, path probabilities and sequence frequencies, from your branch probabilities and initiating frequency. | Uncertainty propagation, importance measures and minimal cut sets. |
| Reliability Block Diagram | Nothing, beyond writing m/n under an m-out-of-n block. | System reliability, availability and failure rate. Block values are shown as supplied. |
| Goal Structuring Notation | Nothing. The structure is checked against the connections the standard permits. | The confidence or sufficiency of the argument. |
| Markov State Diagram | Nothing. Rates and state probabilities are shown as supplied. | State probabilities, availability and mean times. The model is not solved. |
Fault Tree AnalysisPreparing fault tree data, gate rules, transfers and validation.Bow-Tie Risk AnalysisEdge lists and registers, escalation factors, reading a bow-tie and validation.Event Tree AnalysisPreparing event tree data, sequences and frequencies, and validation.Reliability Block DiagramSeries, parallel and m-out-of-n structures, block types and validation.Goal Structuring NotationPreparing an argument, elements and decorators, and validation.Markov State DiagramOne row per transition, states and transitions, rates on the diagram and validation.Notation profilesThe standards each diagram type can be drawn to.How the visual reads your dataReading direction and default orientation per diagram type.Bring in your own diagramWhich type fits a drawing, an export or a plain hierarchy you already have.