









Fault Tree Analysis
What the fault tree analysis (FTA) diagram type draws, what it does not calculate, the standards that describe it, and its defaults.
What it draws
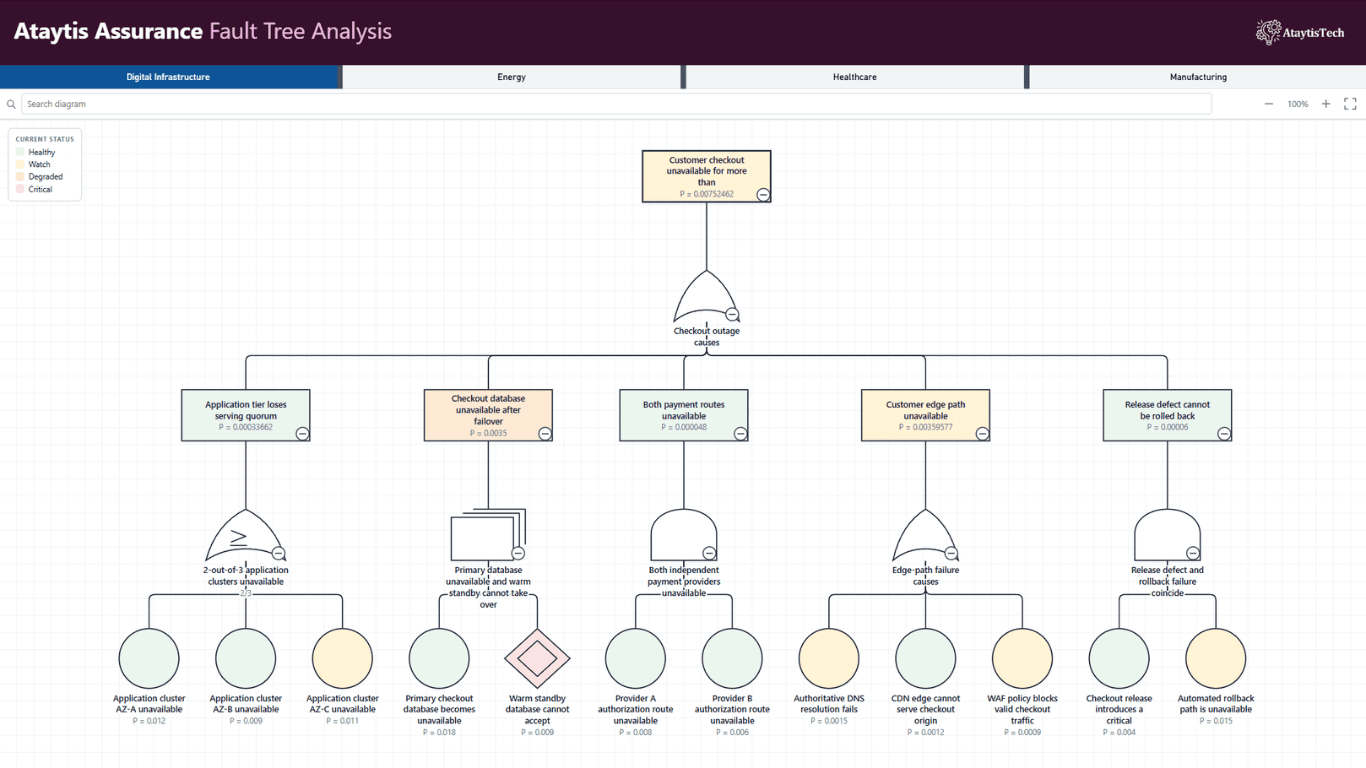
Fault Tree Analysis draws how a top event can occur. The top event can be any outcome you want to explain, such as a service outage, a product defect or a safety incident. It is developed through logic gates into intermediate events, and down to basic, undeveloped and house events that are not developed further. The tree is drawn top to bottom by default.
What it calculates
Nothing. Probabilities, failure rates, repair rates and mission times are displayed and checked as your data supplies them. The visual does not calculate a top-event probability, minimal cut sets or importance measures, and never converts a failure rate into a probability. A probability on a top or intermediate event is shown exactly as the data states it.
Standards
The default profile is designed with reference to IEC 61025:2006, Fault tree analysis (FTA). Fault tree analysis also appears in IEC 31010:2019, IEC 60300-3-1:2003, IEC 62740:2015, IEC 61508-6:2010, IEC 61511-3:2016, SAE ARP4761A:2023, ISO 26262-10:2018, MIL-STD-882E, ISO/TR 24971:2020, EN 50126-2:2017 and ECSS-Q-ST-40-12C, which adopts IEC 61025 for space projects. Notation standards lists what each one covers.
Defaults
| Setting | Default |
|---|---|
| Notation profile | IEC 61025:2006. Traditional / NUREG-0492 and Custom are also available. |
| Orientation | Top to bottom |
| Connected node is read as | The parent: the node directly above the row |
| Node type when no Node Type column is mapped | Intermediate event |
| Relationship type when the cell is blank | Gate/event input |
| Probability display | Tooltip only |
| Voting criterion | Drawn on the gate as k/n |