









Reliability Block Diagram
What the reliability block diagram (RBD) type draws, what it does not calculate, the standards that describe it, and its defaults.
What it draws
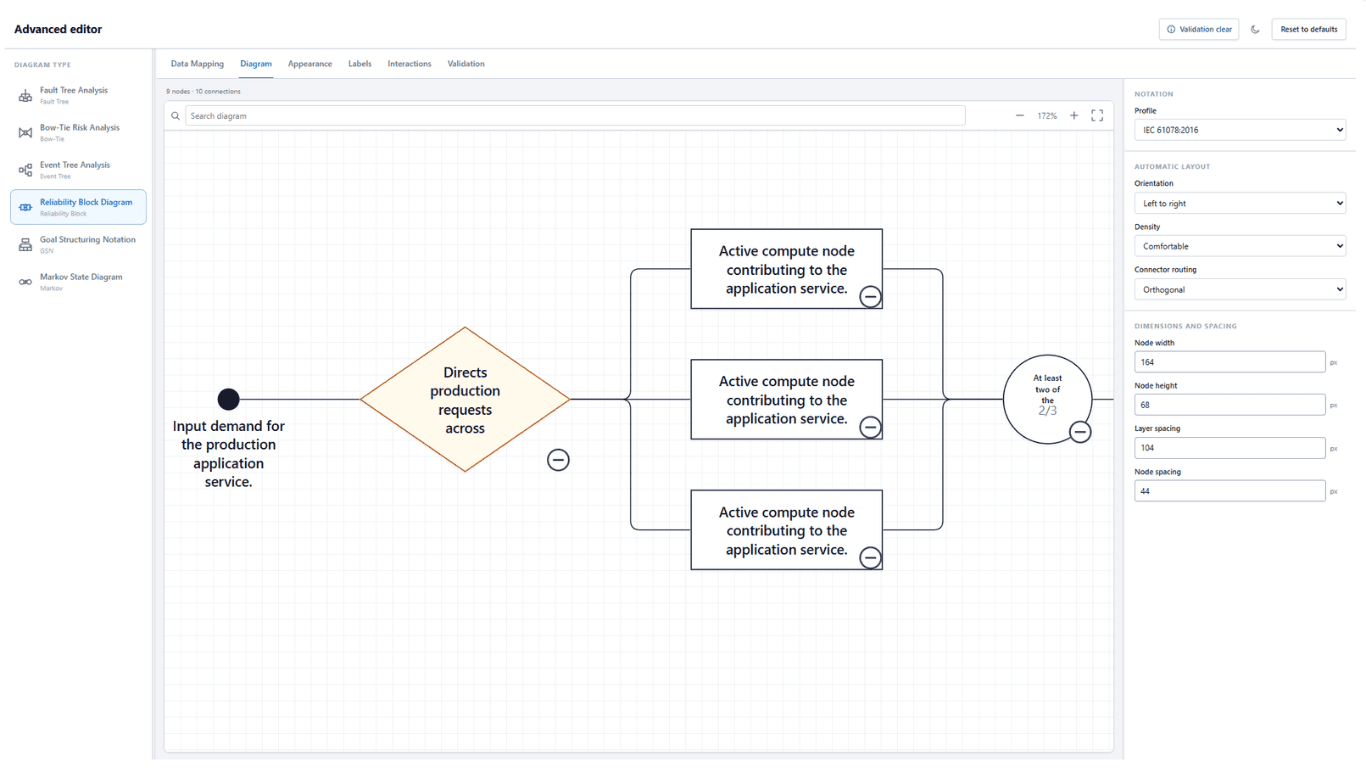
A Reliability Block Diagram shows which combinations of blocks have to work for a system to work. It reads from an input on the left to an output on the right. Blocks in a line are in series, so every one must work. Blocks side by side between a split and a merge are in parallel, so one path is enough. An m-out-of-n block needs a set number of the blocks that feed it. The blocks can be anything a system depends on: pumps and valves, servers and network links, or the machines on a production line.
What it calculates
Nothing. Reliability, availability and failure rate are shown as your data supplies them. The visual does not calculate system reliability, availability or failure rate, and it does not check that the values fall in any range. The one thing it draws from your numbers is the m/n ratio of an m-out-of-n block.
Standards
The IEC 61078:2016 profile is designed with reference to IEC 61078:2016, Reliability block diagrams. Reliability block diagrams also appear in IEC 60300-3-1:2003, IEC 61508-6:2010 and EN 50126-2:2017, and SAE ARP4761A:2023 describes the same technique as dependence diagrams. Notation standards lists what each one covers.
Defaults
| Setting | Default |
|---|---|
| Notation profile | Custom. IEC 61078:2016 is also available. |
| Orientation | Left to right. Custom allows every orientation; IEC 61078:2016 allows left to right and right to left. |
| Connected node is read as | The next block: the node this row leads to |
| Required mappings | Node ID |
| Node type when the cell is blank | Component |
| Relationship type when the cell is blank | Series path |
| Connector routing | Orthogonal |
| Summary strip | Off. When turned on, it counts components, subsystems and standby components by Status. |