AtaytisTech Visuals
Microsoft-certified Power BI custom visuals.




AtaytisTech Library
Vega specifications you configure here and paste in.






Toolkit. Build faster with ready-made assets.
20 products
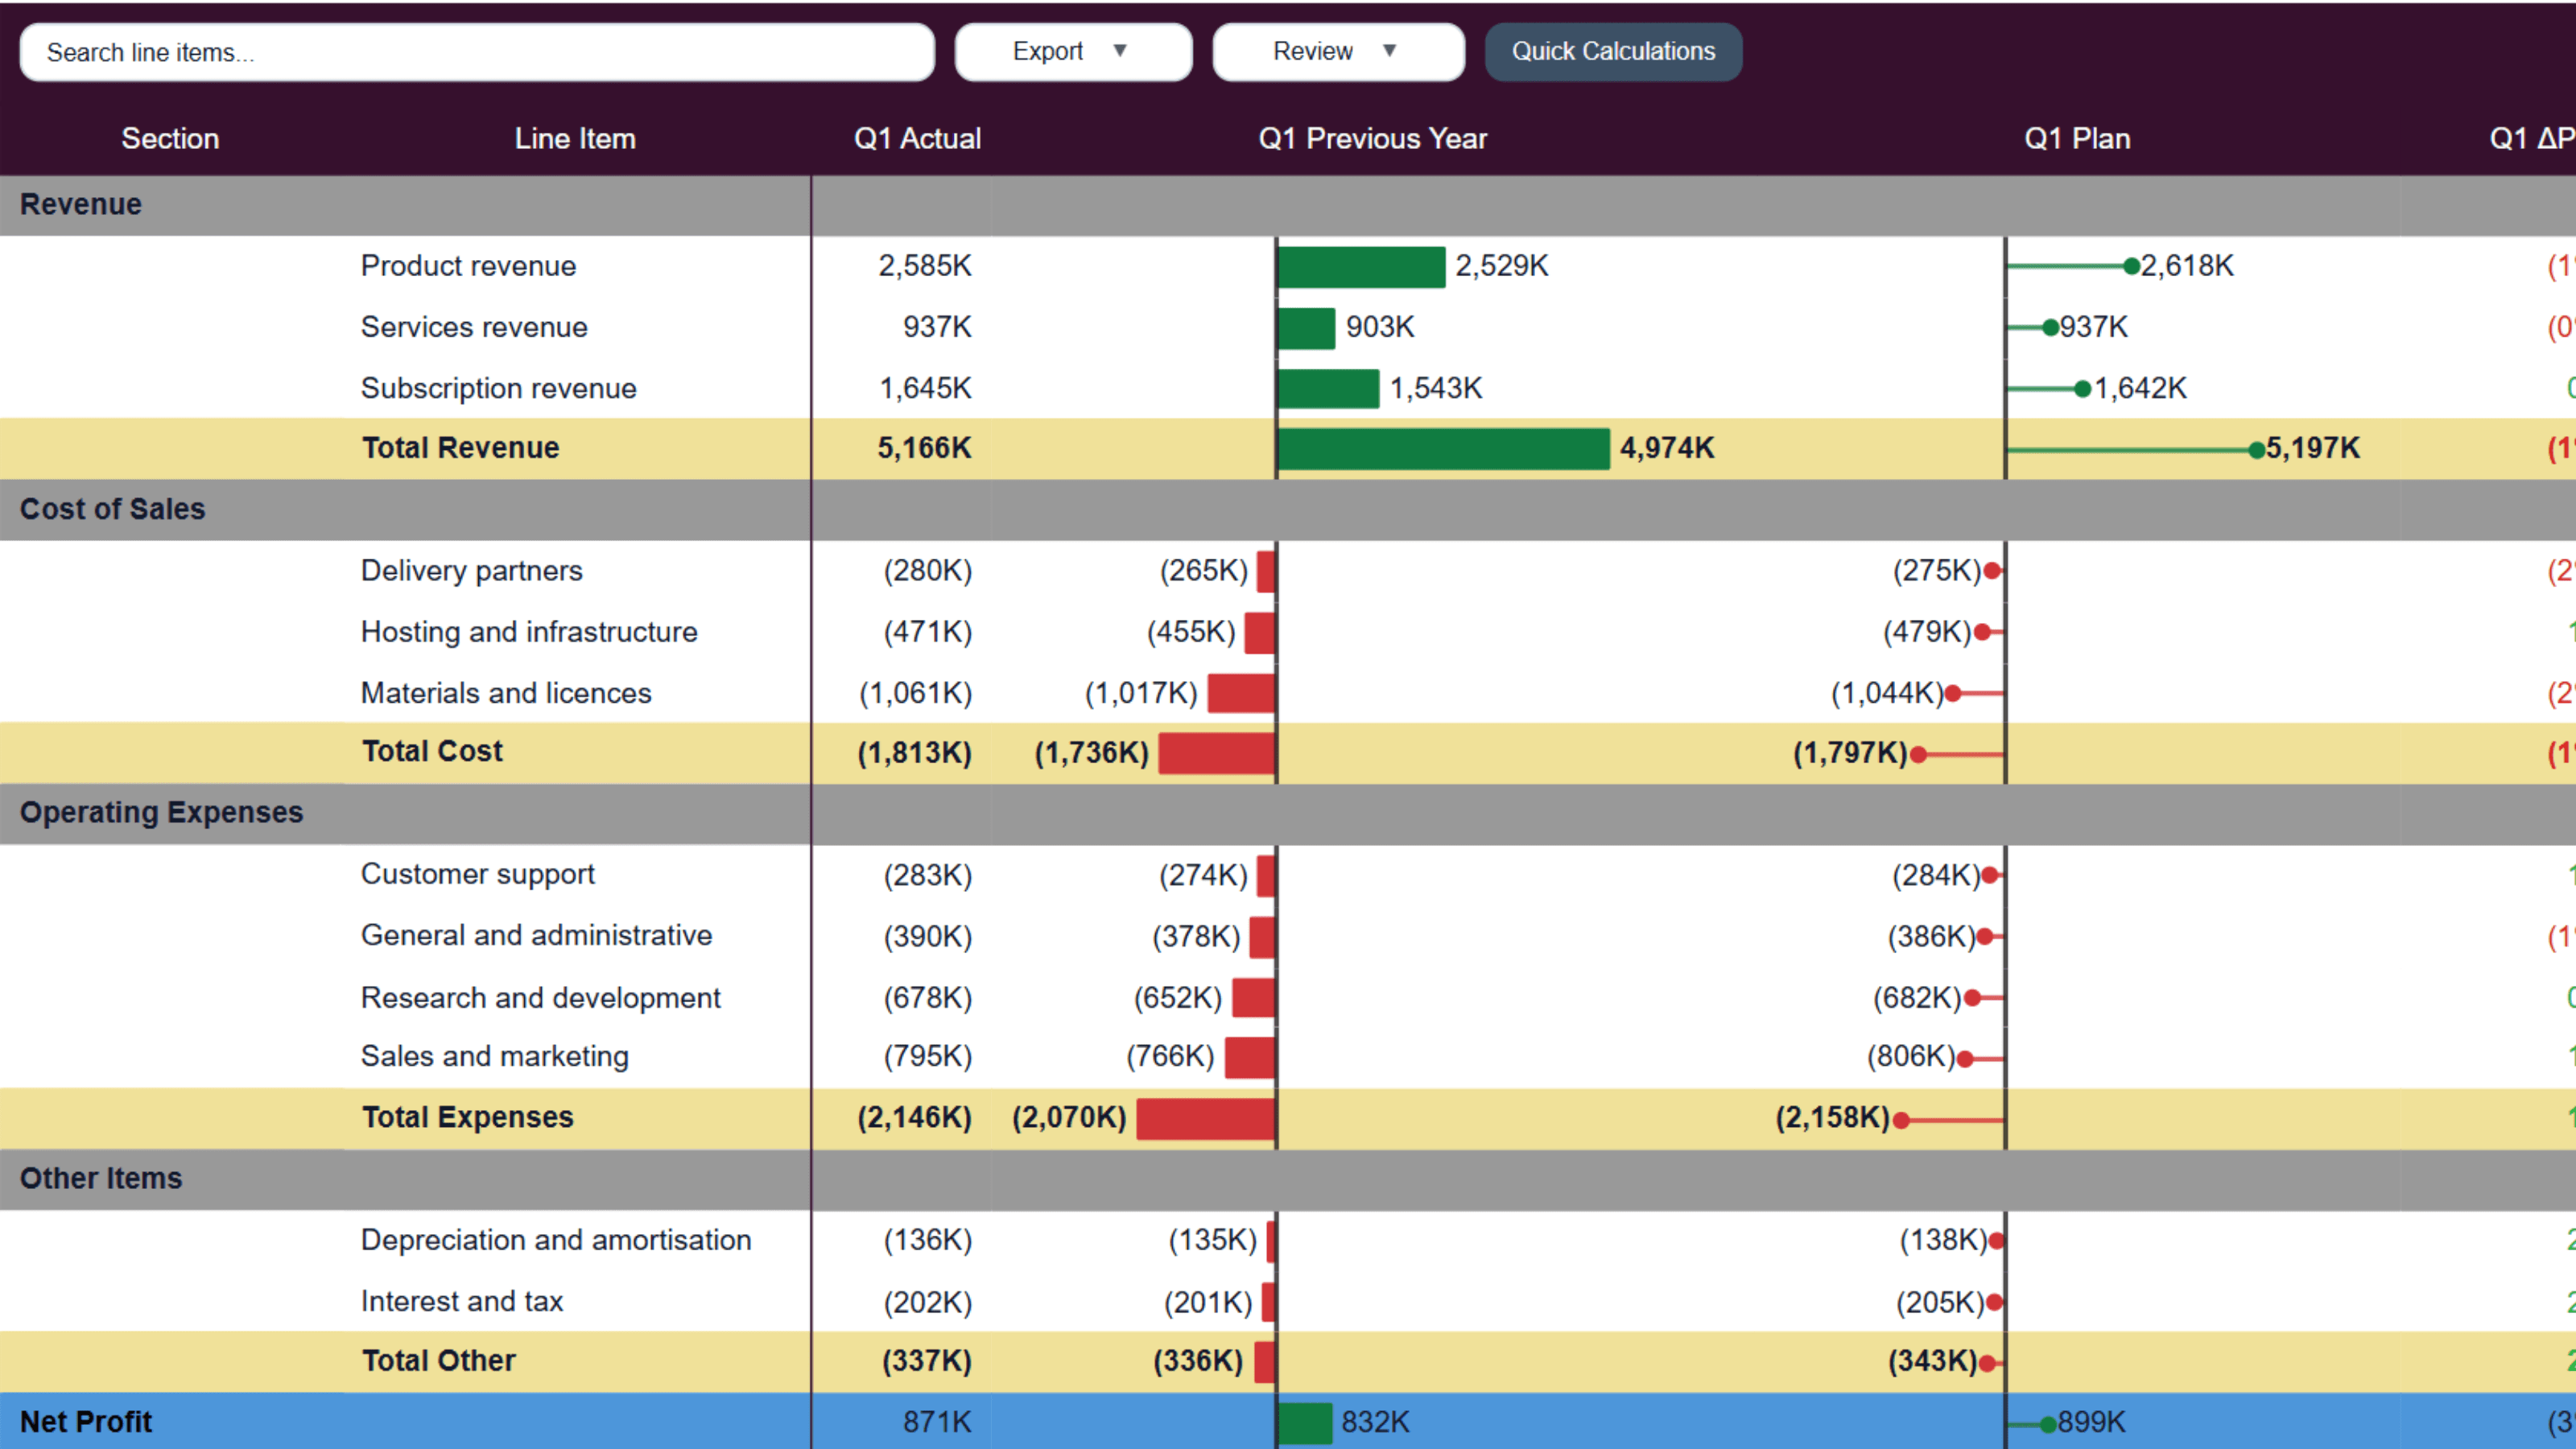
Ataytis Matrix
A Microsoft-certified Power BI matrix built for the tables the standard visual cannot handle — deeply customisable, comparison-aware, and exportable.
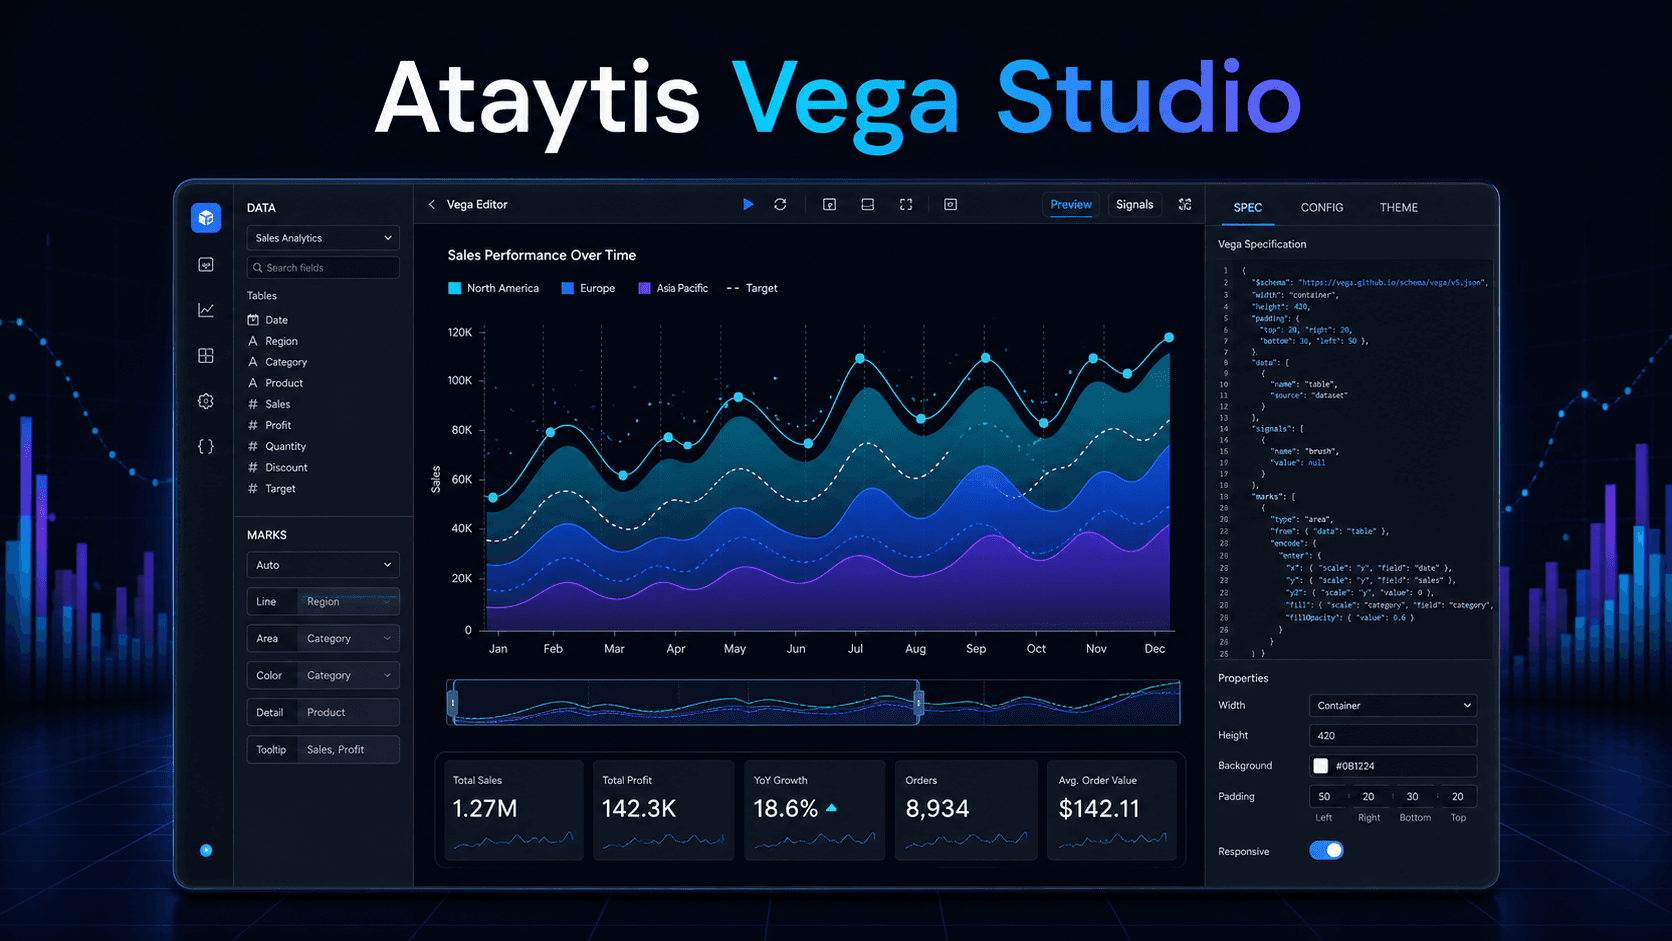
Ataytis Vega Studio
A free, Microsoft-certified Power BI visual that puts a Vega editor, live preview, and data inspector on the report canvas.
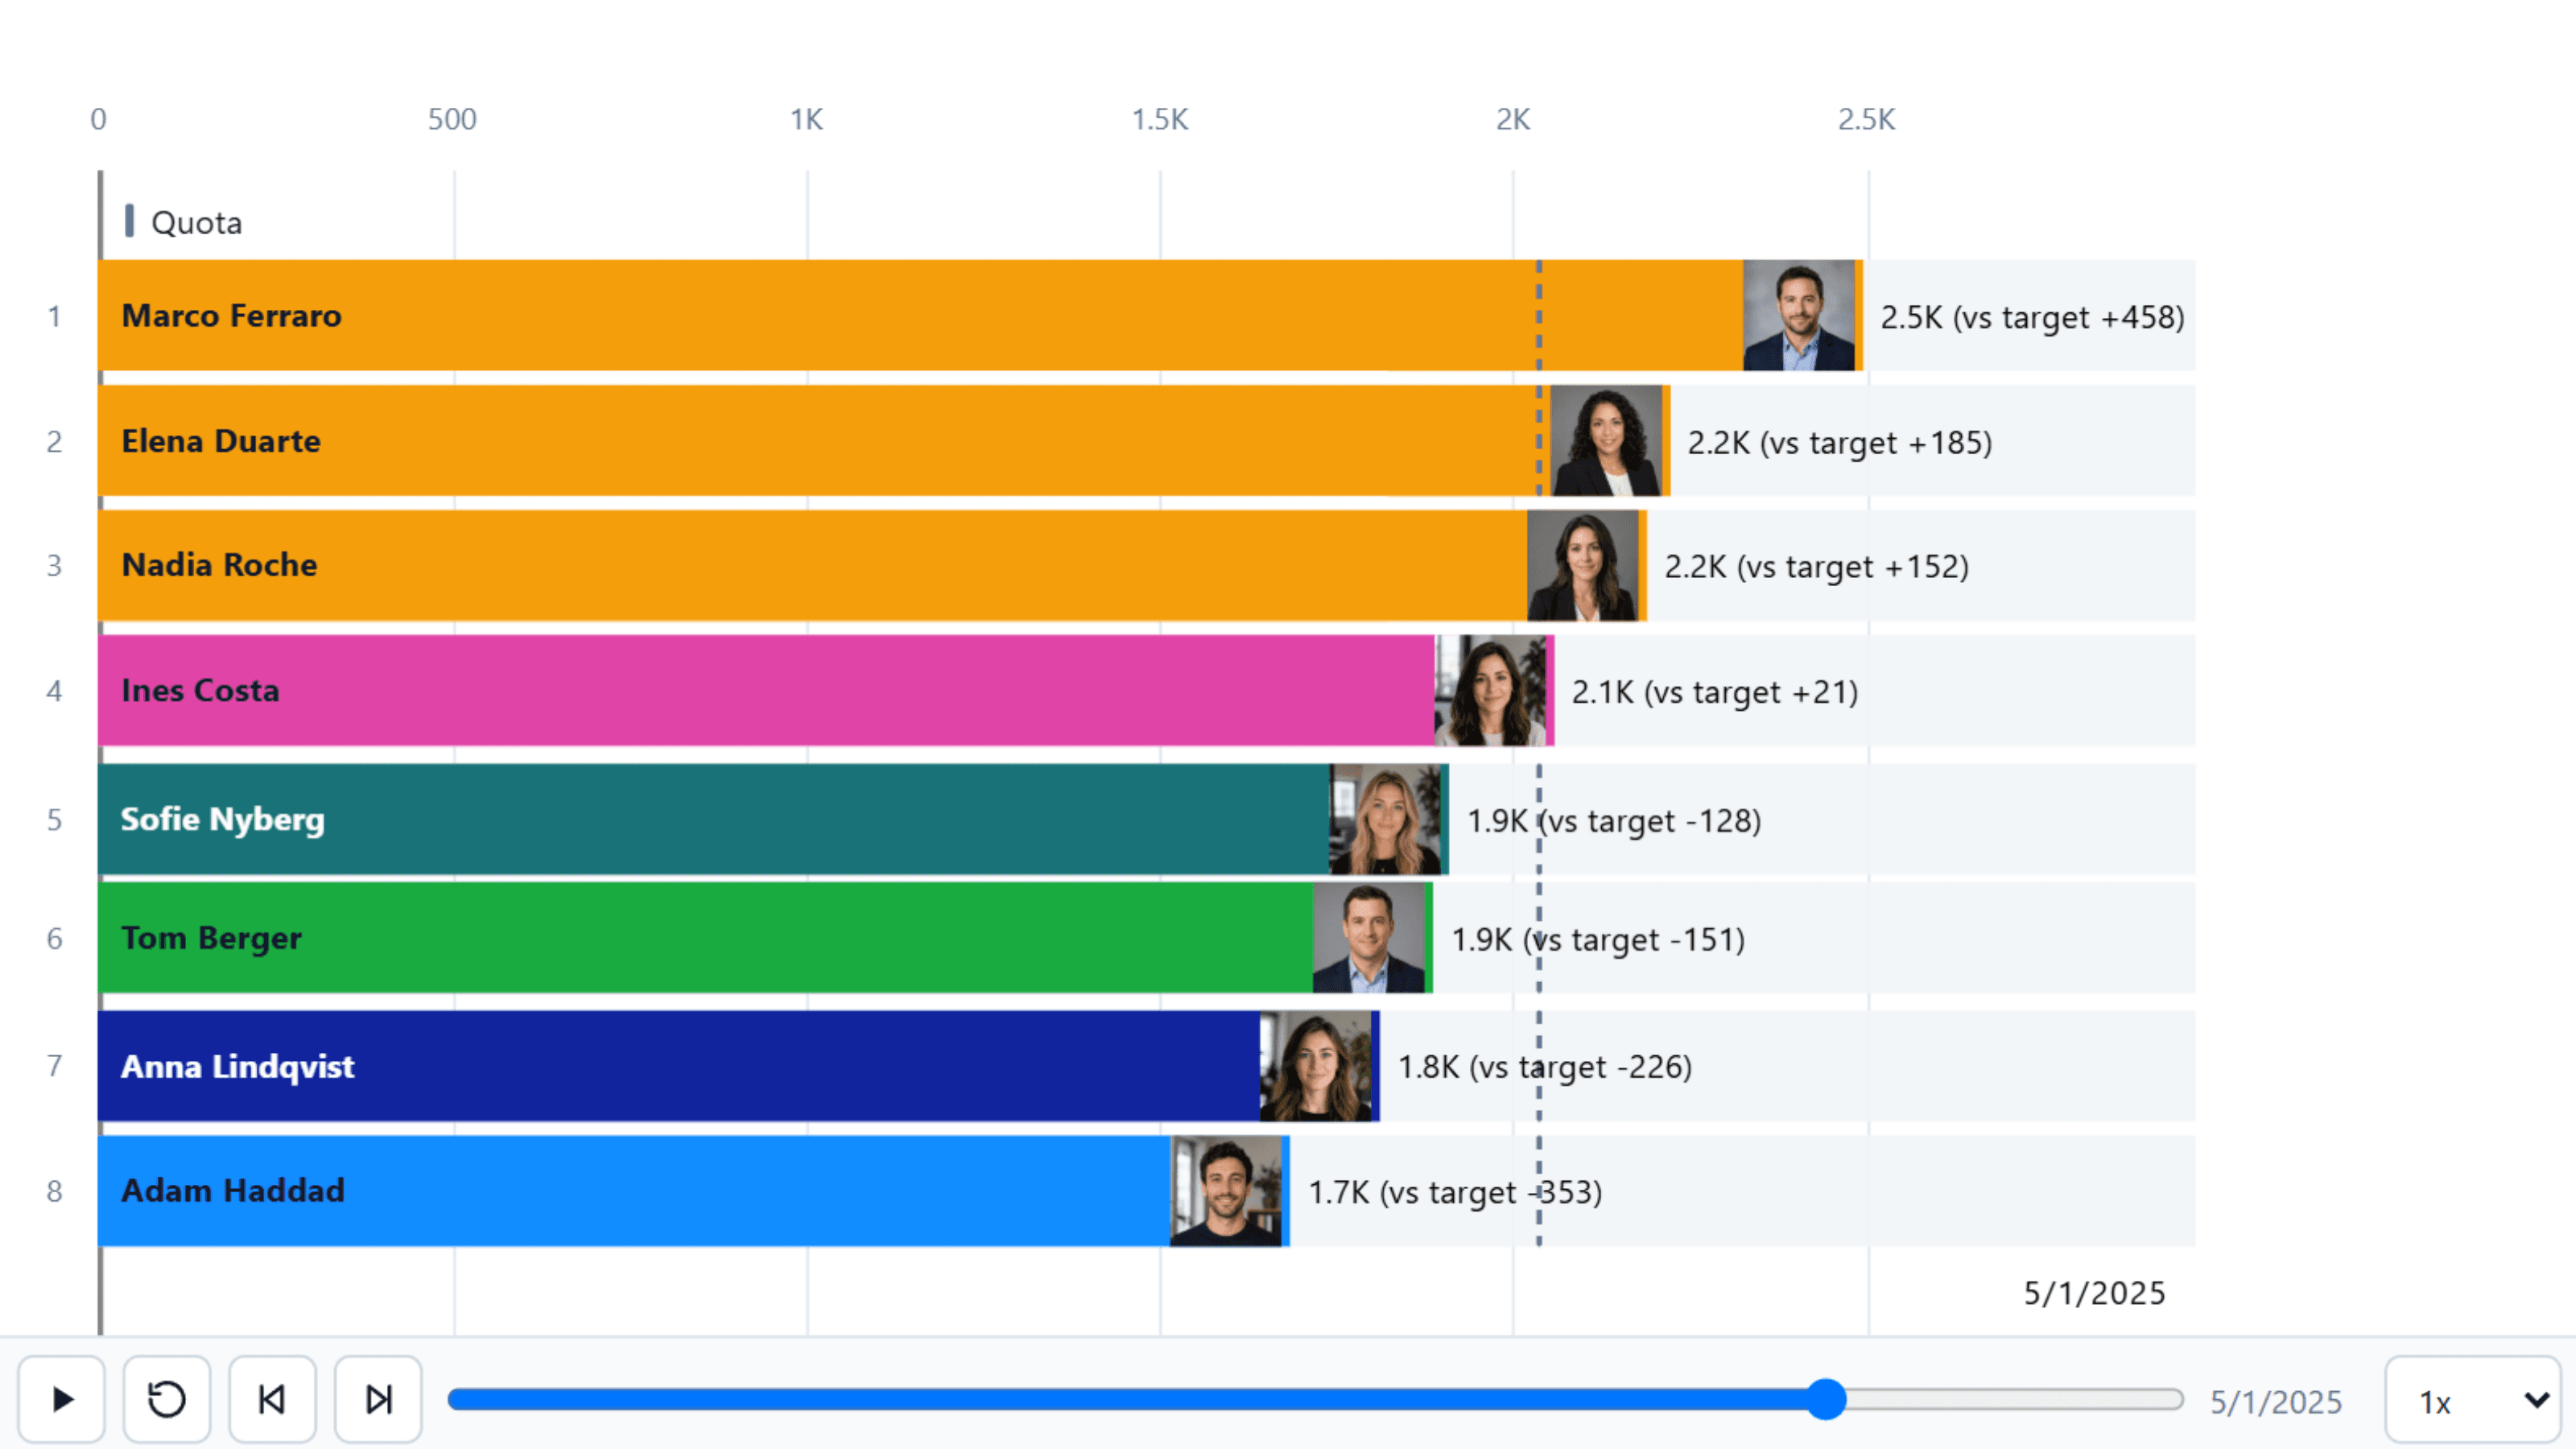
Ataytis Motion
A Microsoft-certified Power BI visual for animated ranking, history and comparison charts — eleven chart types driven by one animation engine and one editor.
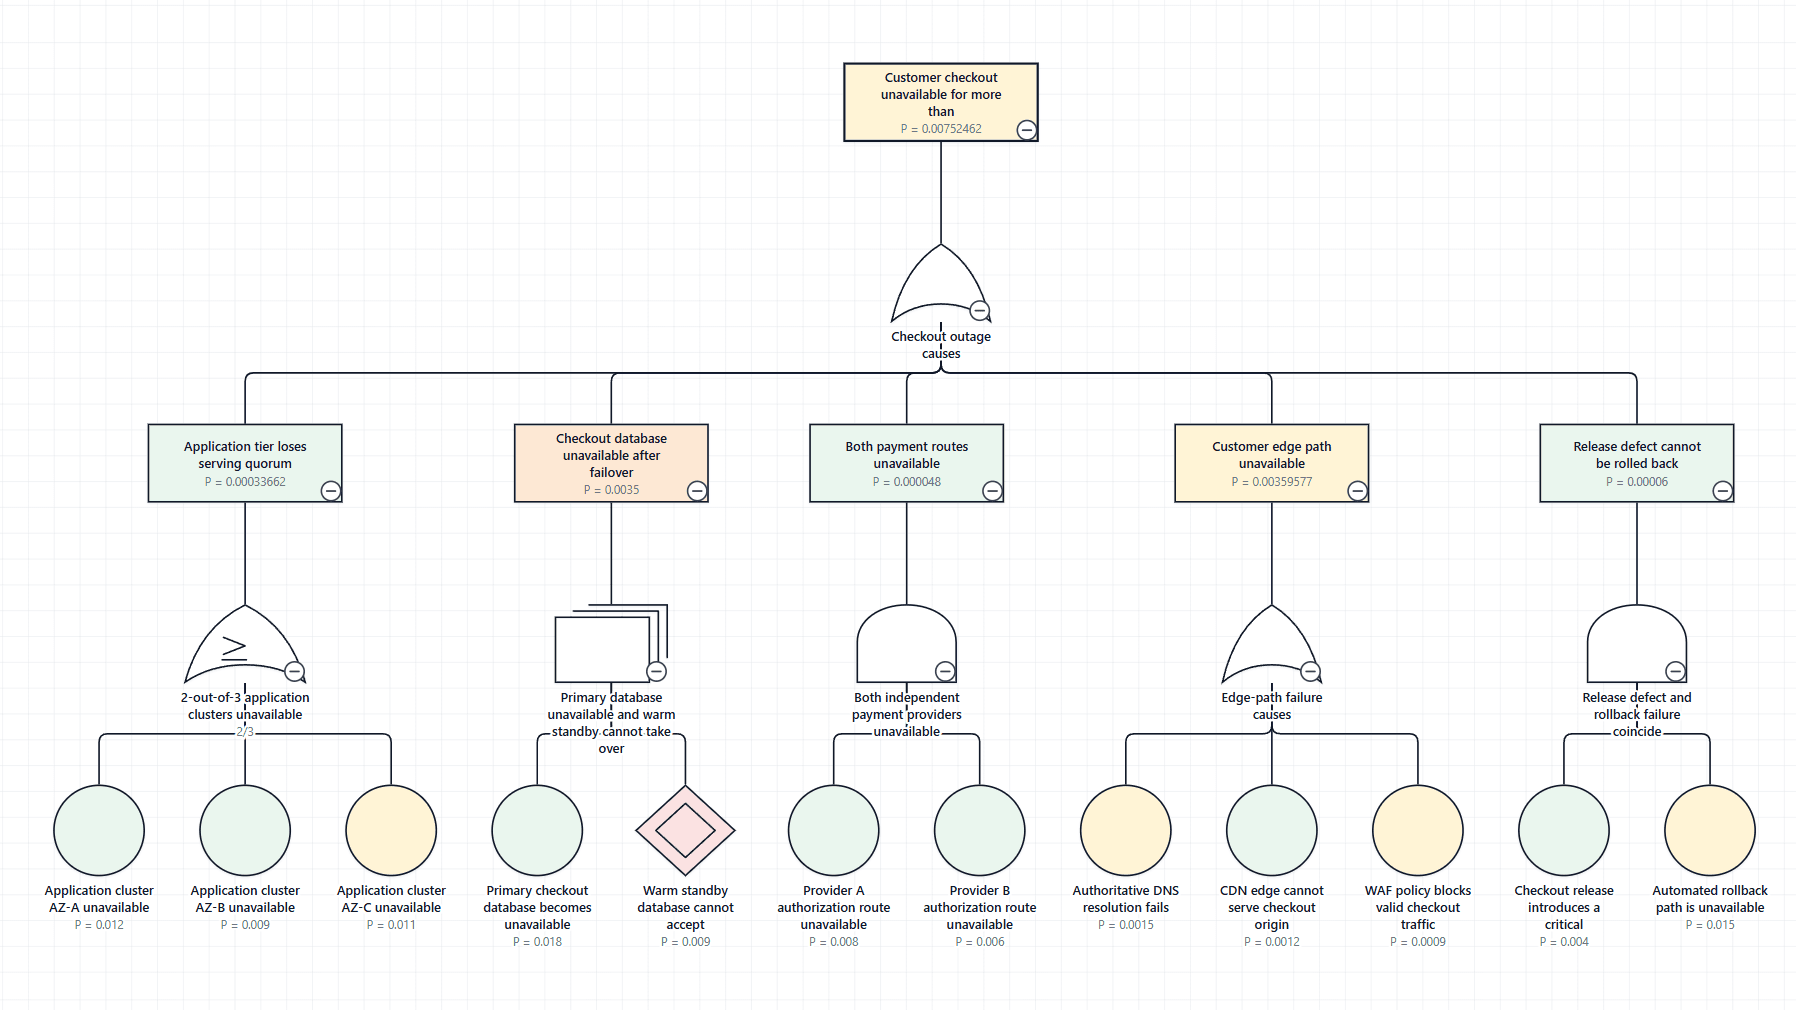
Ataytis Assurance
A Microsoft-certified Power BI visual for fault tree (FTA), bow-tie, event tree (ETA), reliability block (RBD), Goal Structuring Notation (GSN) and Markov diagrams.
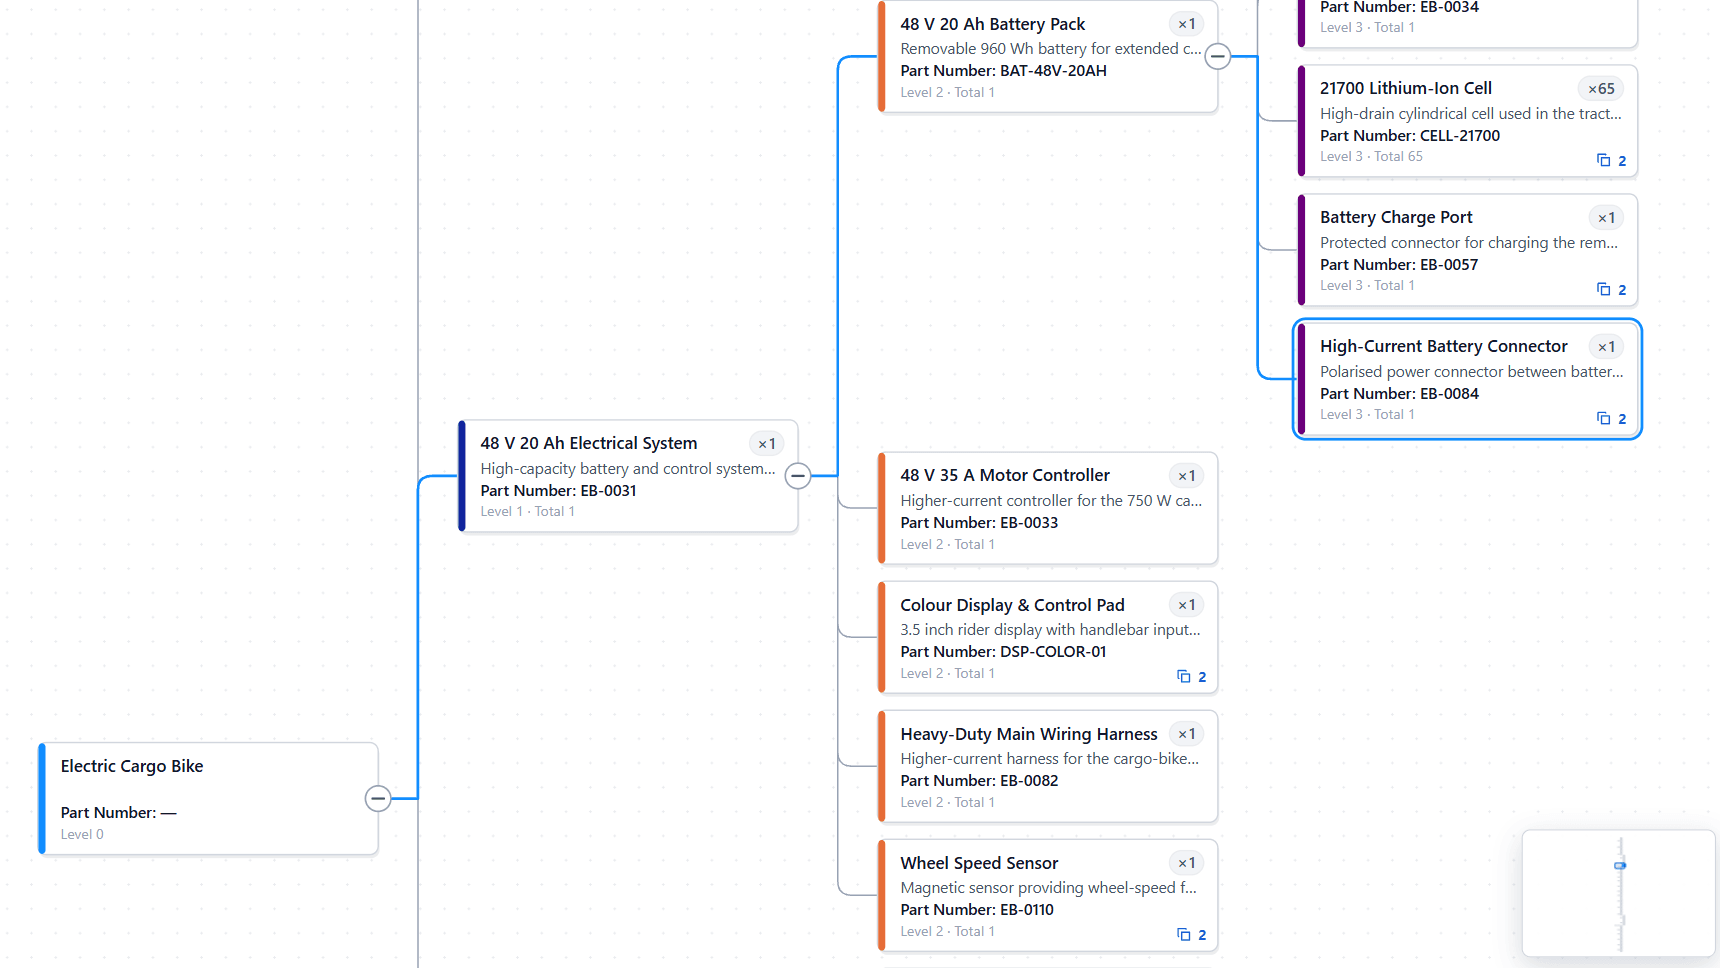
Ataytis BOM
A Microsoft-certified Power BI visual for exploring multi-level, multi-parent bills of materials from Parent–Child rows, as a hierarchy tree, an indented table, or both.

Live Clock Gauge
Customizable clock gauge asset for adding live time visuals to Power BI reports.

Particle Text Visual
Animated text asset for creating dynamic, customizable Power BI report headers and callouts.
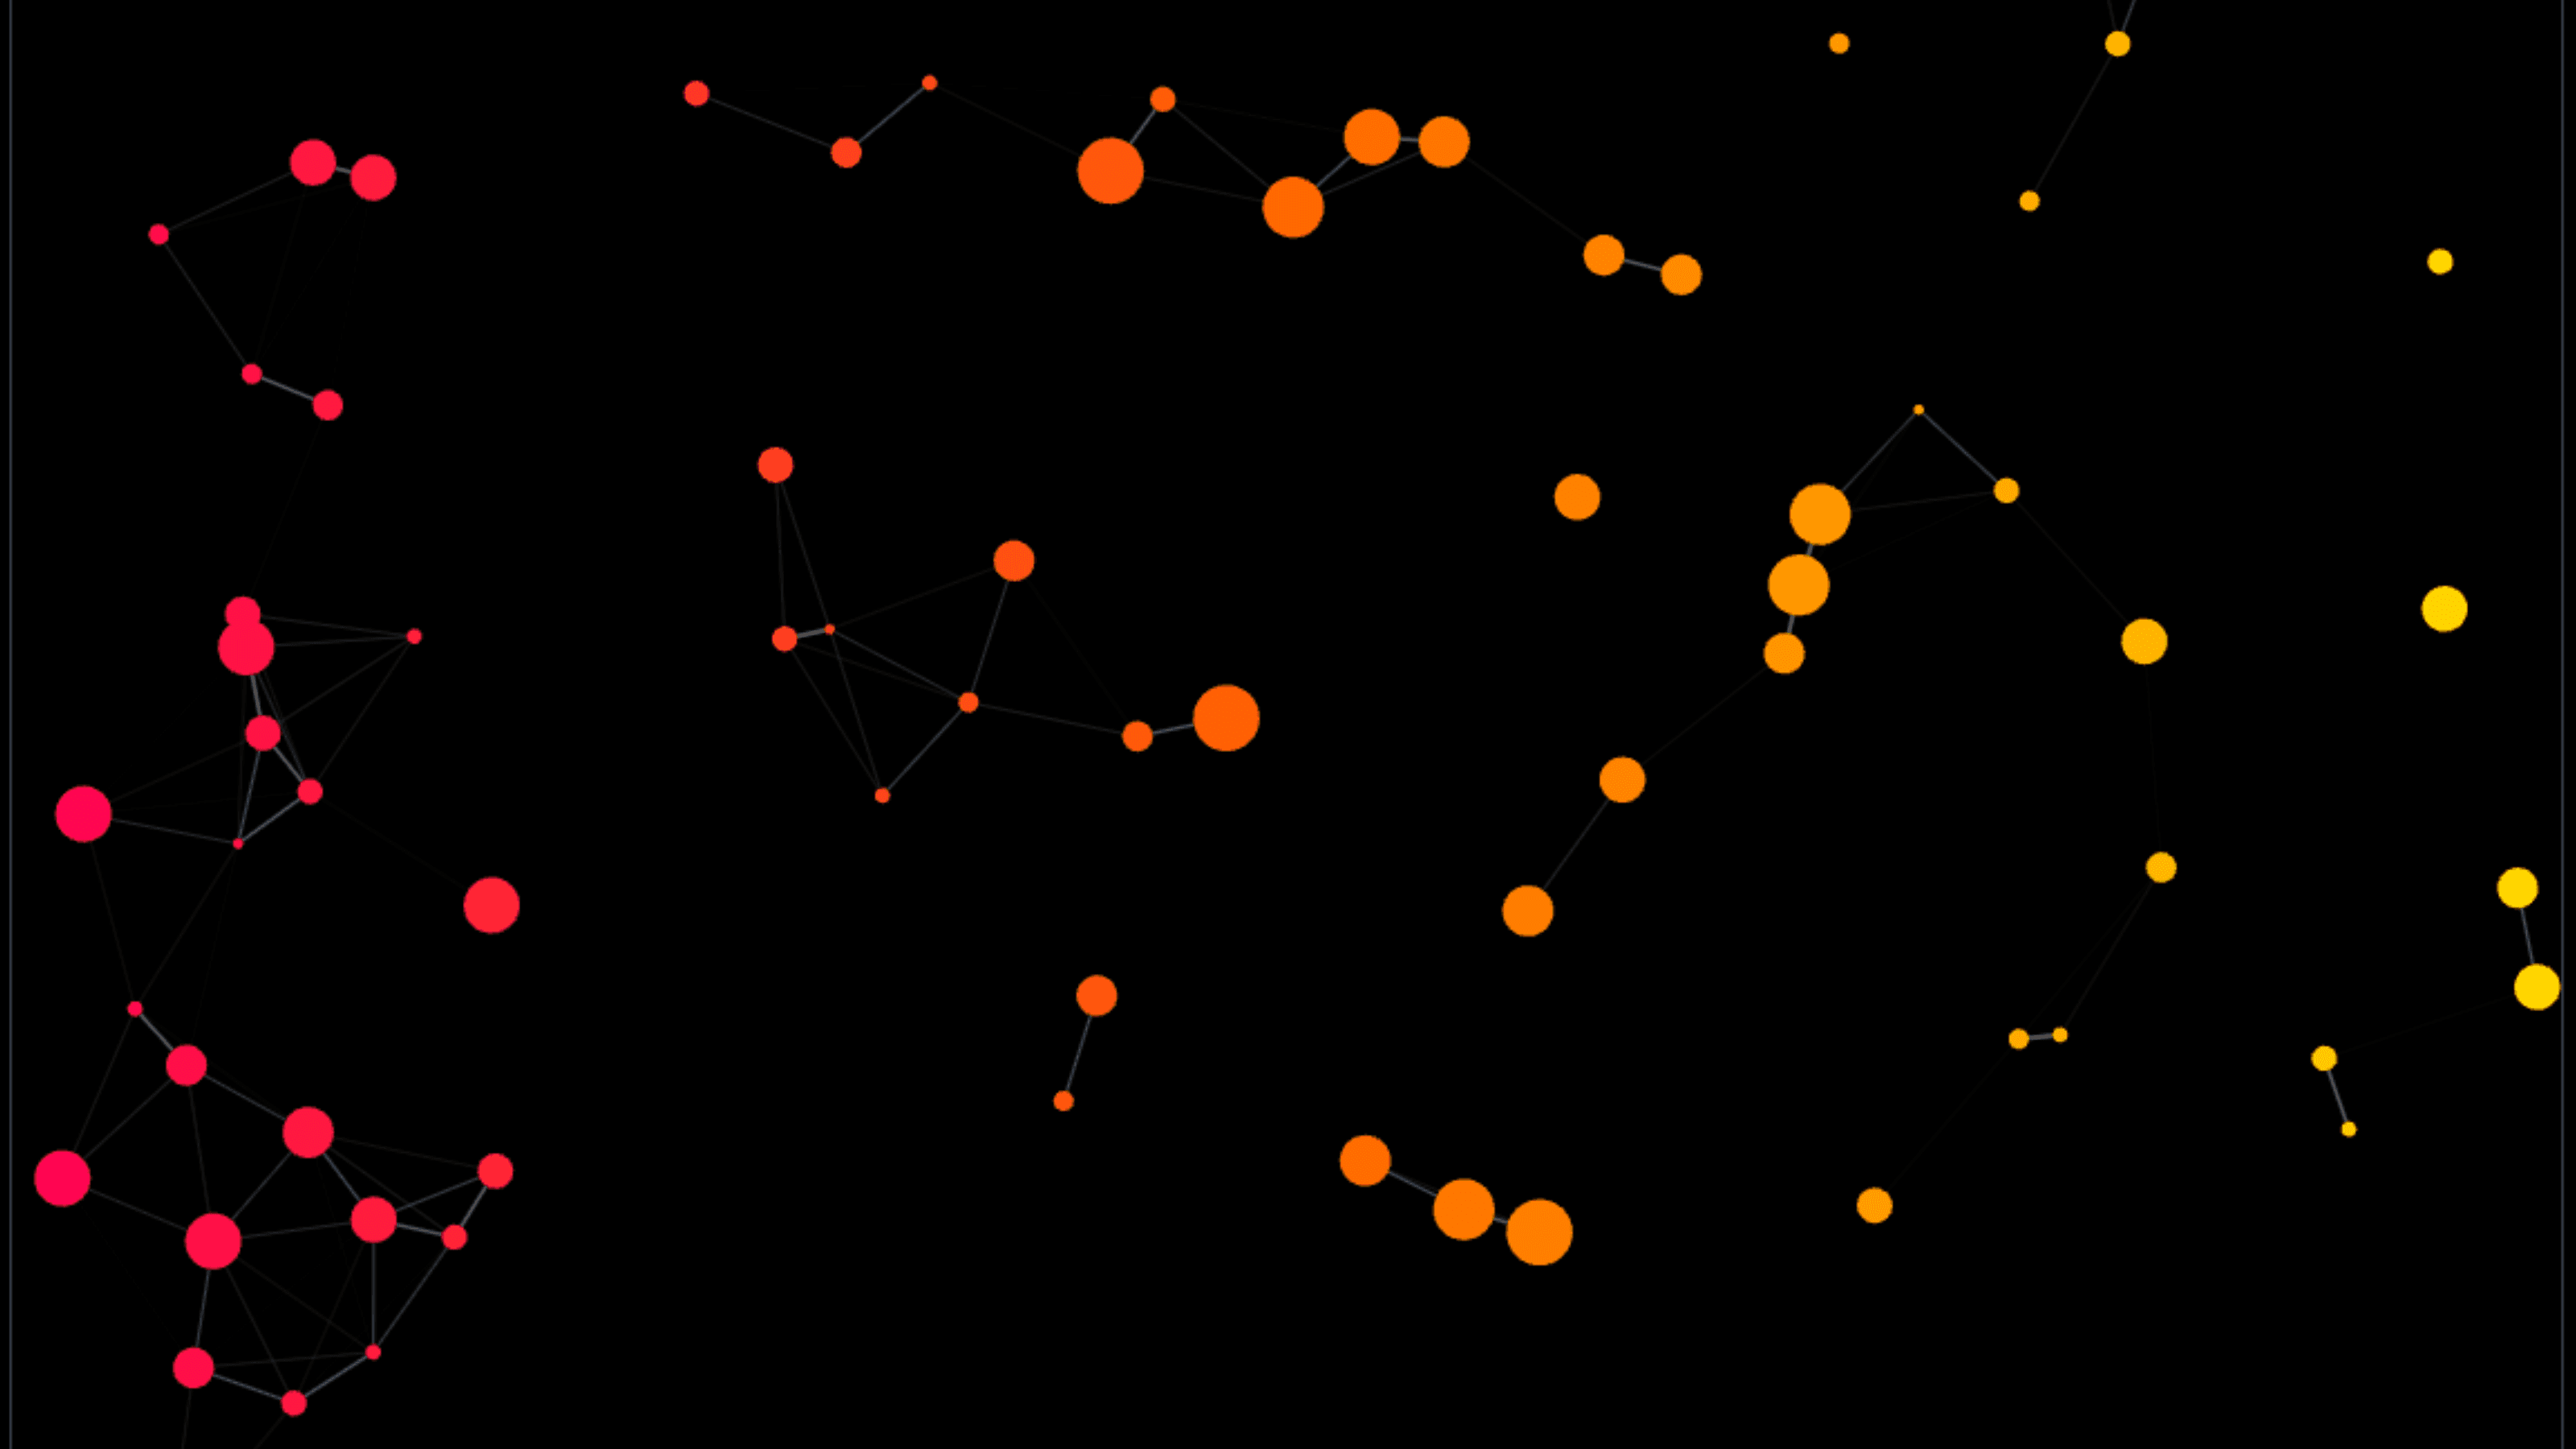
Particle Screen
Animated particle background asset for creating more engaging Power BI report experiences.

World Flags
National flag visuals for Power BI, drawn from official construction sheets and sized to each country’s proportions.

Power QR
QR code generator for Power BI — pick what the code should do, fill in the fields, and copy a working Vega spec.
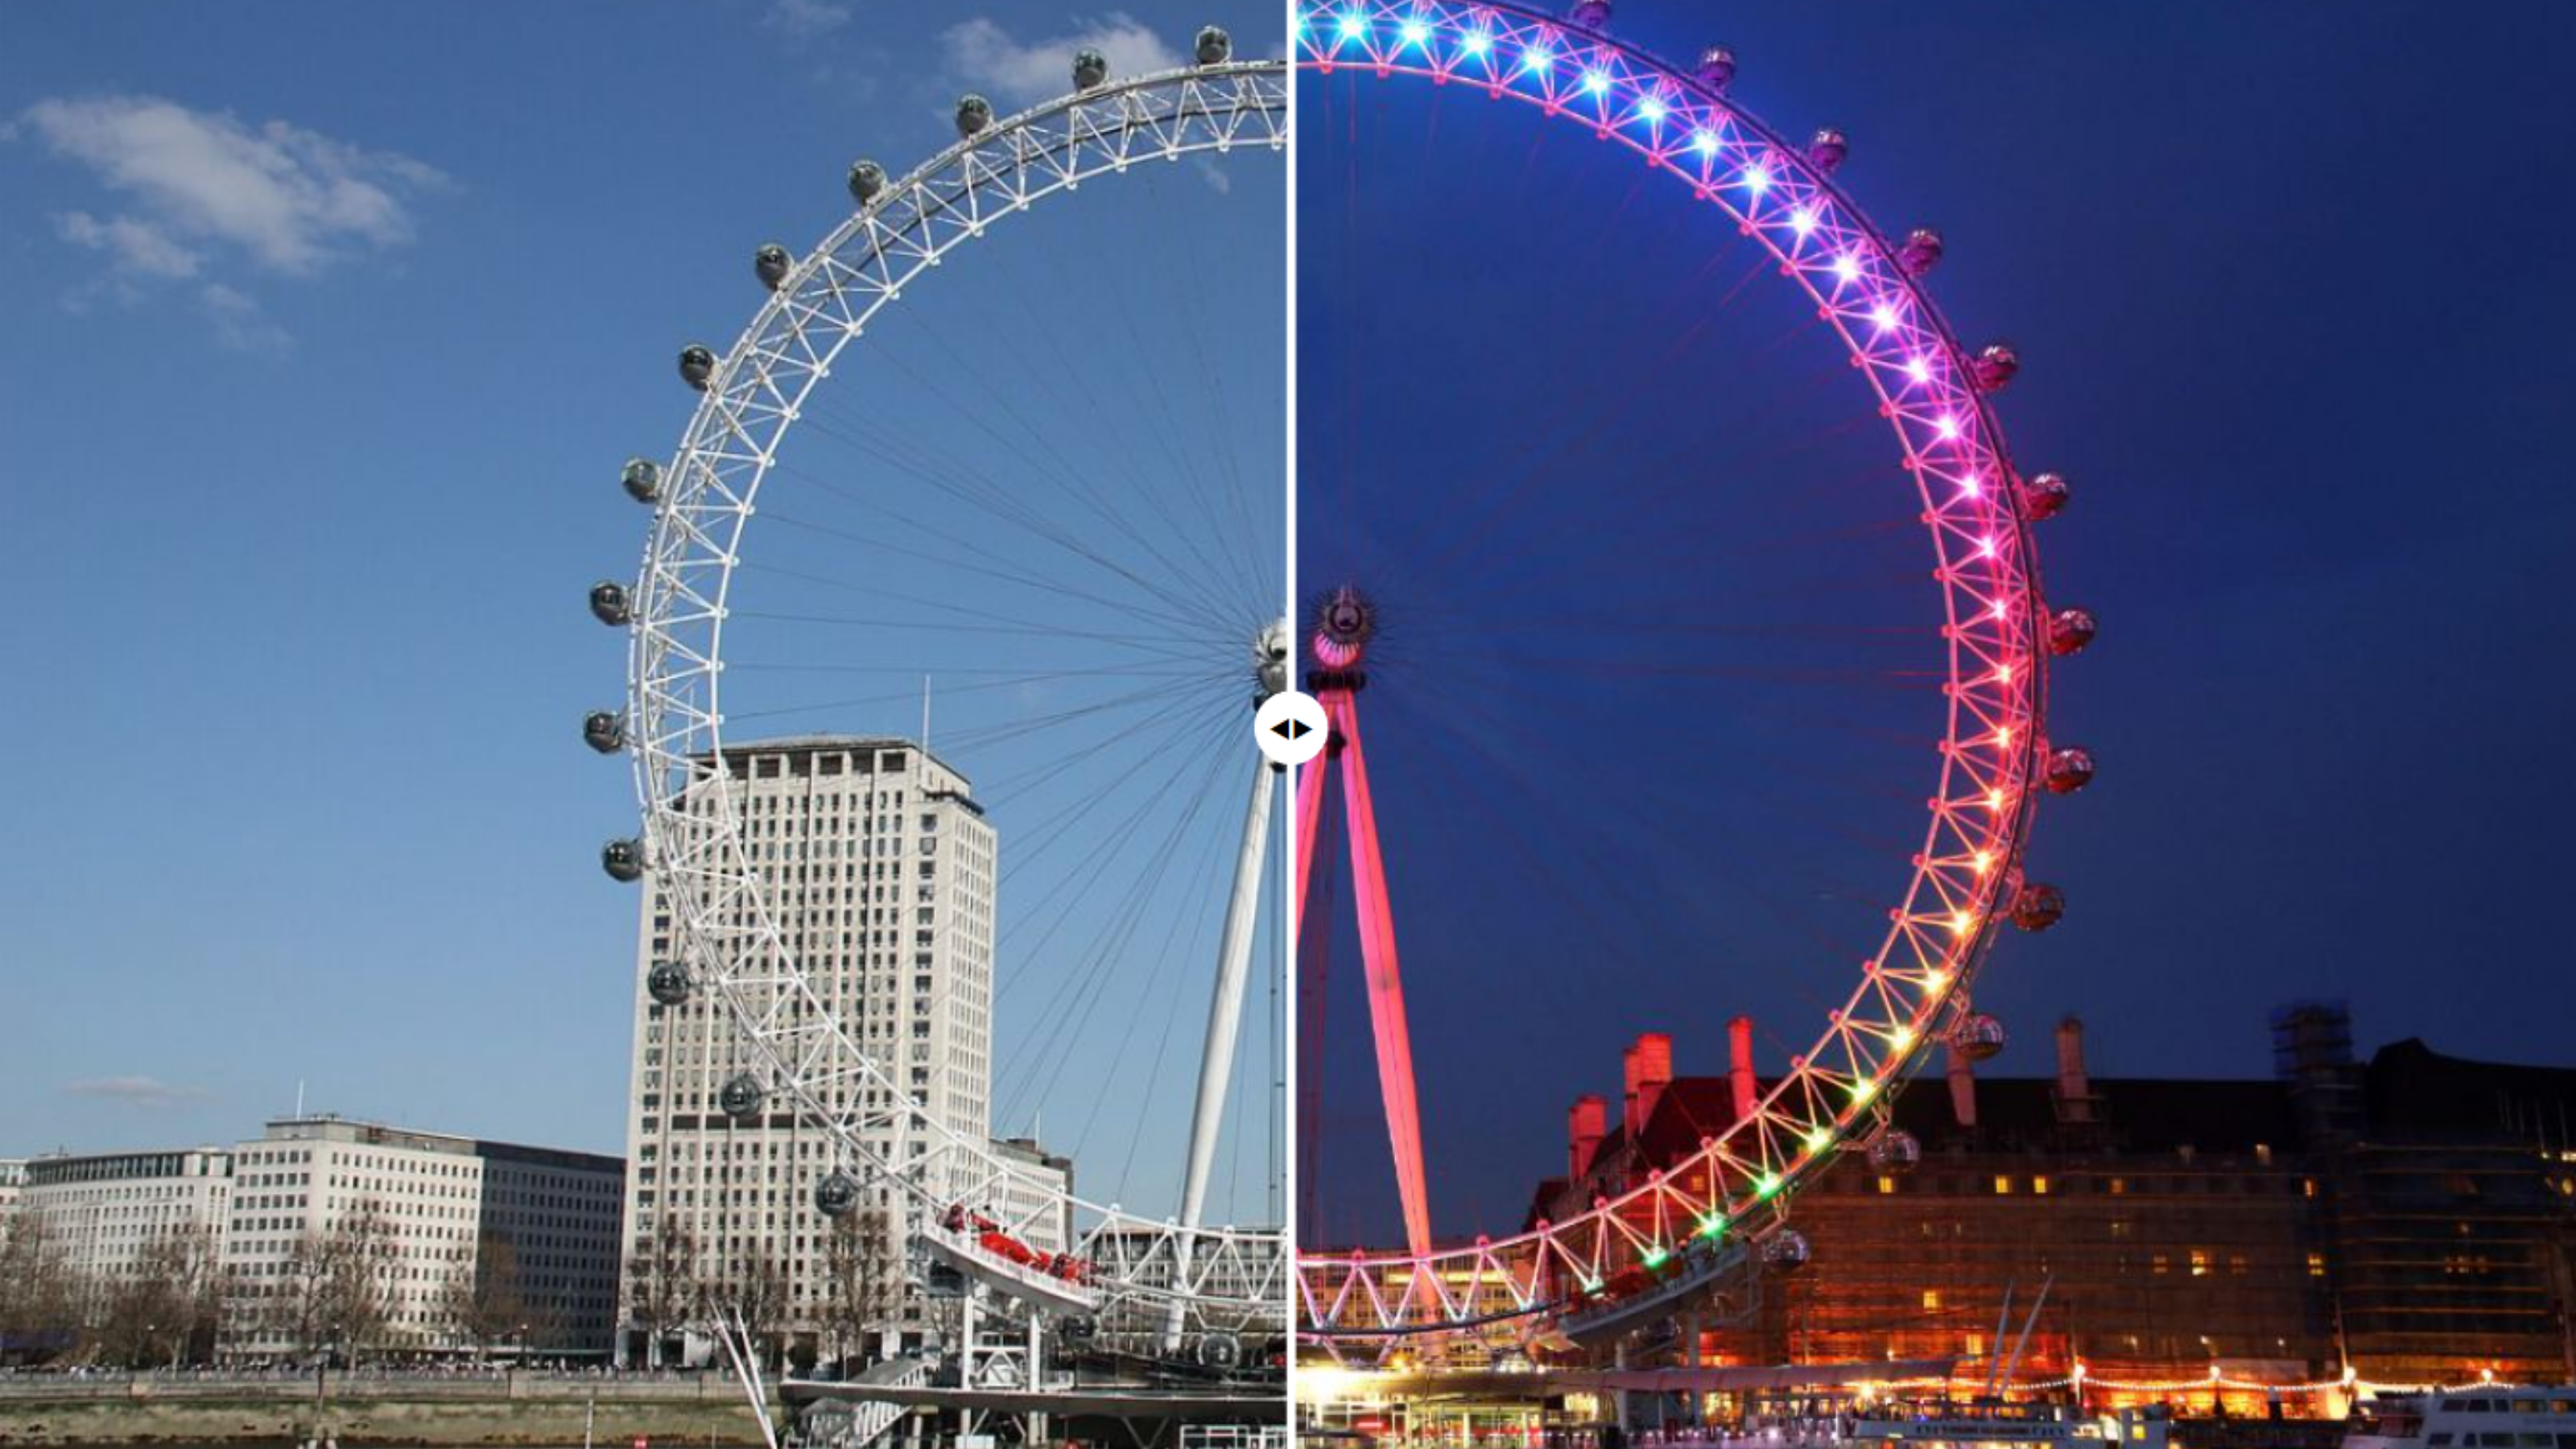
Power Reveal
Interactive before-and-after image comparison for Power BI — drag a handle across two images to reveal the change.
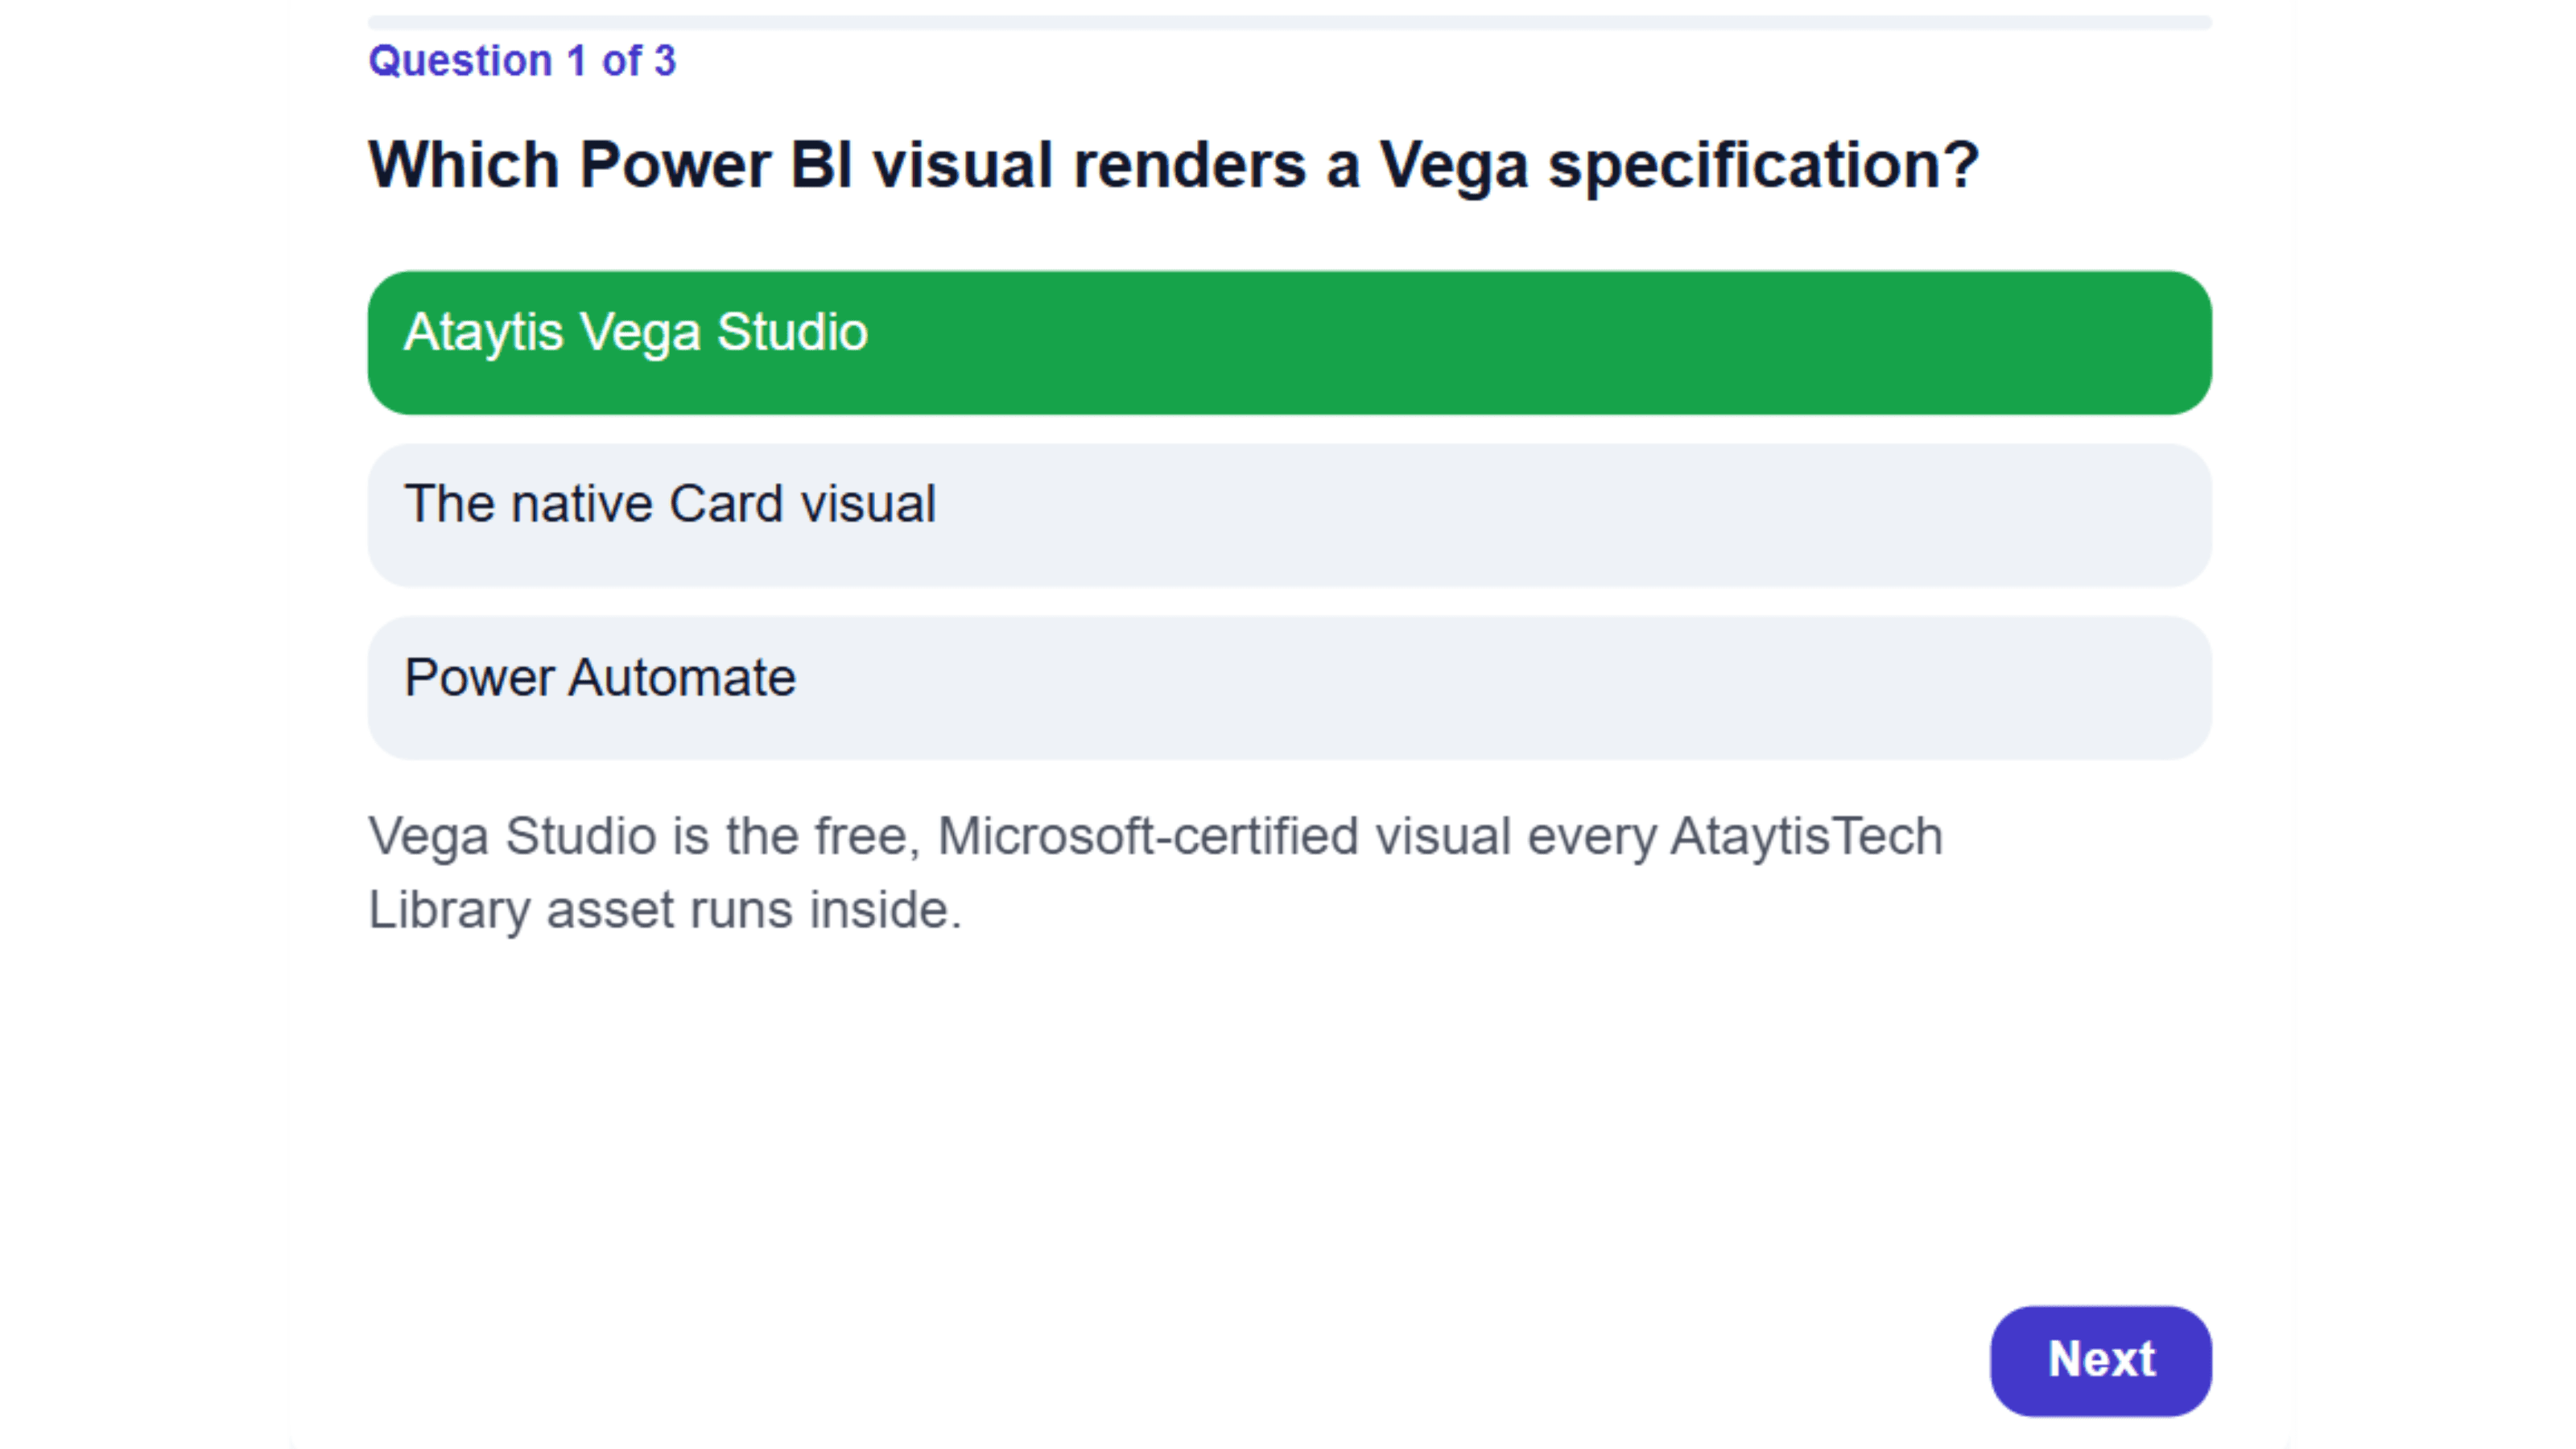
Power Quiz
An interactive multiple-choice quiz that runs inside a Power BI report — write the questions here, paste the spec, and it scores itself.