









Markov State Diagram
What the Markov state diagram type draws for Markov chains and state transition models, what it does not calculate, the standards behind it, and its defaults.
What it draws
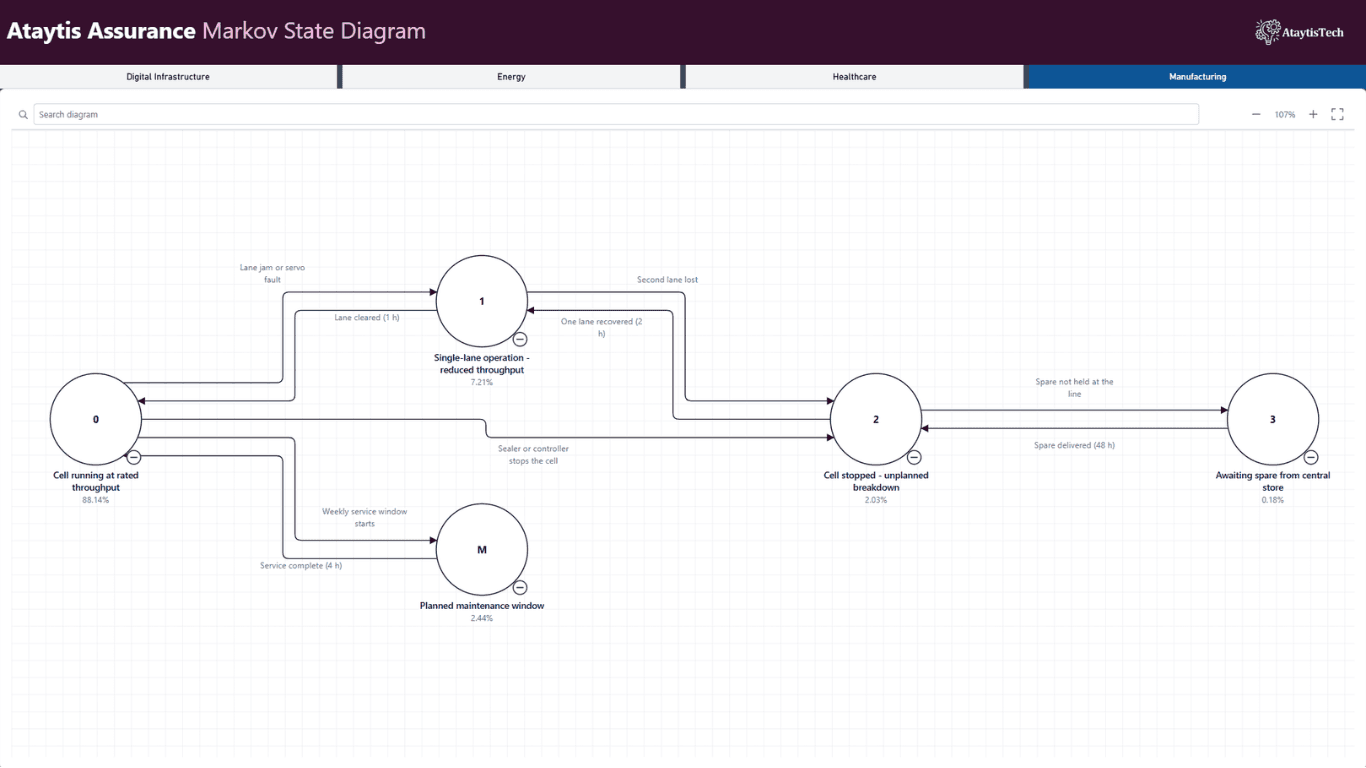
A Markov State Diagram draws a Markov chain as a state transition diagram: the states a system or process can be in, and the transitions between them, each labelled with its rate or probability. It reads left to right from working order to failure. Loops are expected: a repair takes the system back to a state it has already been in, so a failure out and a repair back between the same two states is the ordinary case.
What it calculates
Nothing. The model is not solved. Transition rates and state probabilities are drawn as your data supplies them, and state probabilities are not checked against any range or required to add up to 1. Supply the probabilities your analysis produced.
Standards
The default profile is designed with reference to IEC 61165:2006, Application of Markov techniques. Markov analysis also appears in IEC 31010:2019, IEC 60300-3-1:2003, IEC 61508-6:2010 and SAE ARP4761A:2023. Notation standards lists what each one covers.
Defaults
| Setting | Default |
|---|---|
| Notation profile | IEC 61165:2006. Custom is also available. |
| Orientation | Left to right. Every orientation is available. |
| Connected node is read as | The state this transition reaches |
| Required mappings | Node ID |
| Node type when the cell is blank | State |
| Relationship type when the cell is blank | Transition |
| States drawn as | Circle |
| Connector shows | Its label, or the rate if it has none |
| State probability | Show on state |
| Summary strip | Off. When turned on, it counts states by Status. |