









Field mapping
How bound columns are matched to roles automatically, how to map them by hand, and which roles each diagram type reads.
The Data Mapping tab
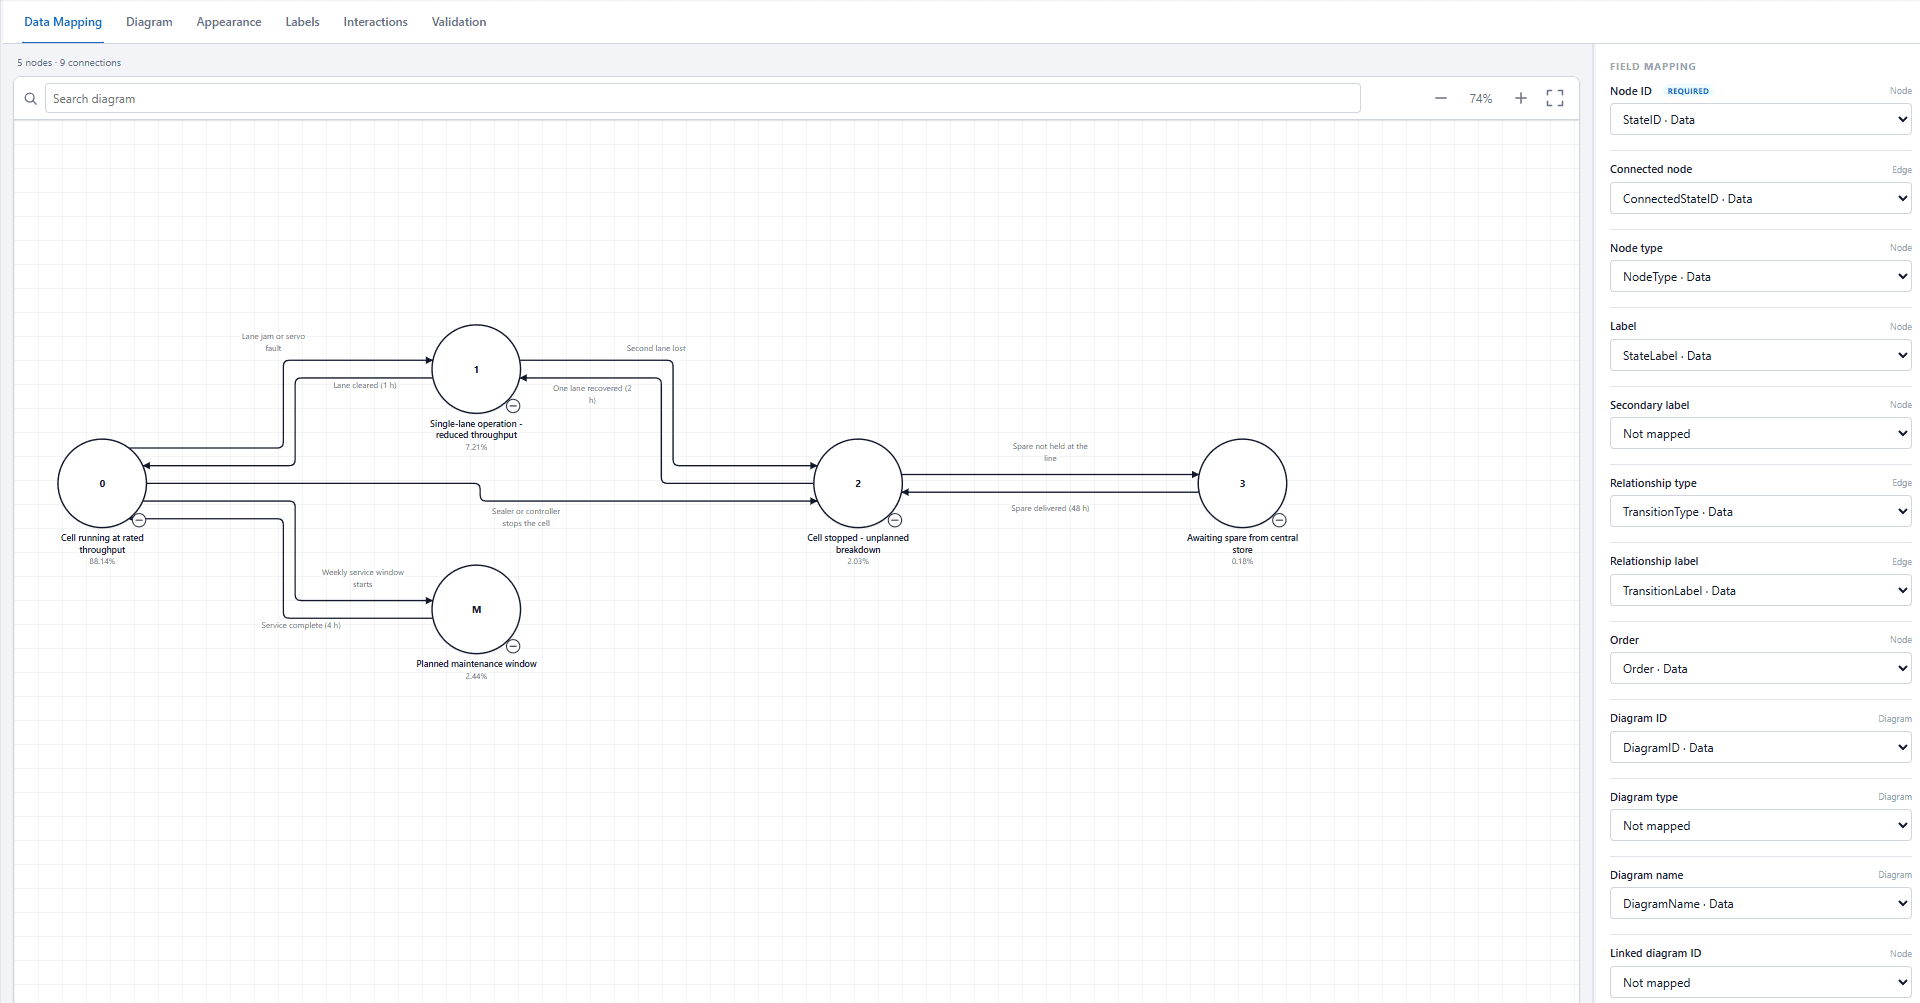
Data Mapping lists every role the selected diagram type reads, required roles first. Beside each role's name, a small note says what it applies to: node, edge, diagram or value. Each role has a dropdown of the fields bound to the visual, labelled with the well each came from, for example Probability · Value. A field whose type does not suit the role is marked type mismatch.
| Status under a role | Meaning |
|---|---|
| Required mapping | A required role has nothing mapped. The diagram will not build until it is mapped. |
| Mapped field is no longer available | The mapped column was removed from the visual or is no longer in the model. |
| More than one field matches this saved mapping | Two bound fields match the saved mapping. Choose the right one. |
Automatic binding
When a role has nothing mapped, the visual looks for a bound column whose name matches one of the names that role is known by. Matching ignores case, spaces and punctuation, so Node_ID, node id and NodeID are the same name. A column is used for one role only.
| Role | Examples of column names that bind automatically |
|---|---|
| Node ID | Node ID, ID, Event ID, Element ID, Code, Reference, State ID |
| Connected node | Parent ID, Parent, Connected node, Connected to, Output, Predecessor, Target, To state, Next state |
| Node type | Node type, Type, Event type, Symbol, Gate type, Category, Kind, State class |
| Label | Label, Description, Title, Event name, Node name, State label |
| Relationship type | Relationship type, Relationship, Link type, Edge type, Transition type |
| Order | Order, Sequence, Sort order, Position, Rank |
| Diagram ID | Diagram ID, Diagram, Tree ID, Model ID, Analysis ID |
| Diagram name | Diagram name, Diagram title, Analysis name, Model name |
| Status | Status, State, Condition, Current status |
| Probability | Probability, Unavailability, Q, Branch probability |
Only the roles the selected diagram type reads are matched. Numeric roles bind only to numeric columns: a text column named Probability is left unmapped rather than mapped to a role it would fail.
Mapping by hand
Choose a field in any role's dropdown. Choosing Not mapped is kept as a decision: automatic binding does not put the column back on the next refresh.
Mappings are stored against the field itself, not its position in the well. Reordering fields does not change a mapping, and removing a mapped field produces a mapping message instead of another column being used in its place.
A saved mapping that points at a column the current table does not contain is not treated as your choice. Automatic binding runs again for that role.
Roles every diagram type reads
| Role | What it does |
|---|---|
| Node ID | Identifies a node. Rows with the same Node ID become one node. |
| Connected node | The node this row connects to. |
| Node type | What the node is. Decides its symbol and which rules apply. |
| Label | Text drawn on the node. |
| Secondary label | A second line of text on the node. |
| Relationship type | What the connection means, where the method distinguishes kinds of connection. |
| Relationship label | Text drawn on the connection. |
| Order | The order of nodes that sit side by side. |
| Diagram ID | Separates several diagrams held in one table. |
| Diagram type | Helps choose which diagram to open when the table holds several. |
| Diagram name | A readable name for each diagram, used in the diagram picker. |
| Linked diagram ID and Linked diagram type | Point a node at another diagram, such as the target of a fault tree transfer. |
Roles specific to each diagram type
| Diagram type | Additional roles |
|---|---|
| Fault Tree Analysis | Probability, Failure rate (λ), Repair rate (μ), Mission time, Voting threshold (k), Voting input count (n), Priority sequence, Event state, Dormancy factor, Spare mode, Required spares, Status |
| Bow-Tie Risk Analysis | Threat, Barrier, Consequence, Top event, Escalation factor, Escalation control, Status, Health |
| Event Tree Analysis | Branch label, Probability, Frequency, Status |
| Reliability Block Diagram | Reliability, Availability, Failure rate, Status, Vote threshold (m), Vote input count (n) |
| Goal Structuring Notation | Status, Health, Relationship ID, Challenged relationship, Identifier, Module reference, Decorators |
| Markov State Diagram | Transition rate, State probability, Status, Absorbing state, Initial state, State class, Failed elements, State identifier, Transition ID |
Units are never converted. A failure rate, repair rate, mission time, frequency or transition rate is shown in whatever unit the report model uses.