Value calculation
What number each frame shows, the seven calculations available, and how the default behaves against a measure that already reports a total.
The setting that decides what a frame means
Value calculation lives on the Chart tab. It decides what number each frame shows, and it is the setting most often left wrong.
| Setting | What each frame shows |
|---|---|
| Current value | That period on its own. |
| Cumulative total | A running total from the first period in the data. |
| Rolling window | The last N periods, N being a window you set. |
| Change from first | The difference from the first period. |
| % change from first | The same as a percentage. |
| Change from previous | The difference from the period before. |
| % change from previous | The same as a percentage. |
Flows and stocks
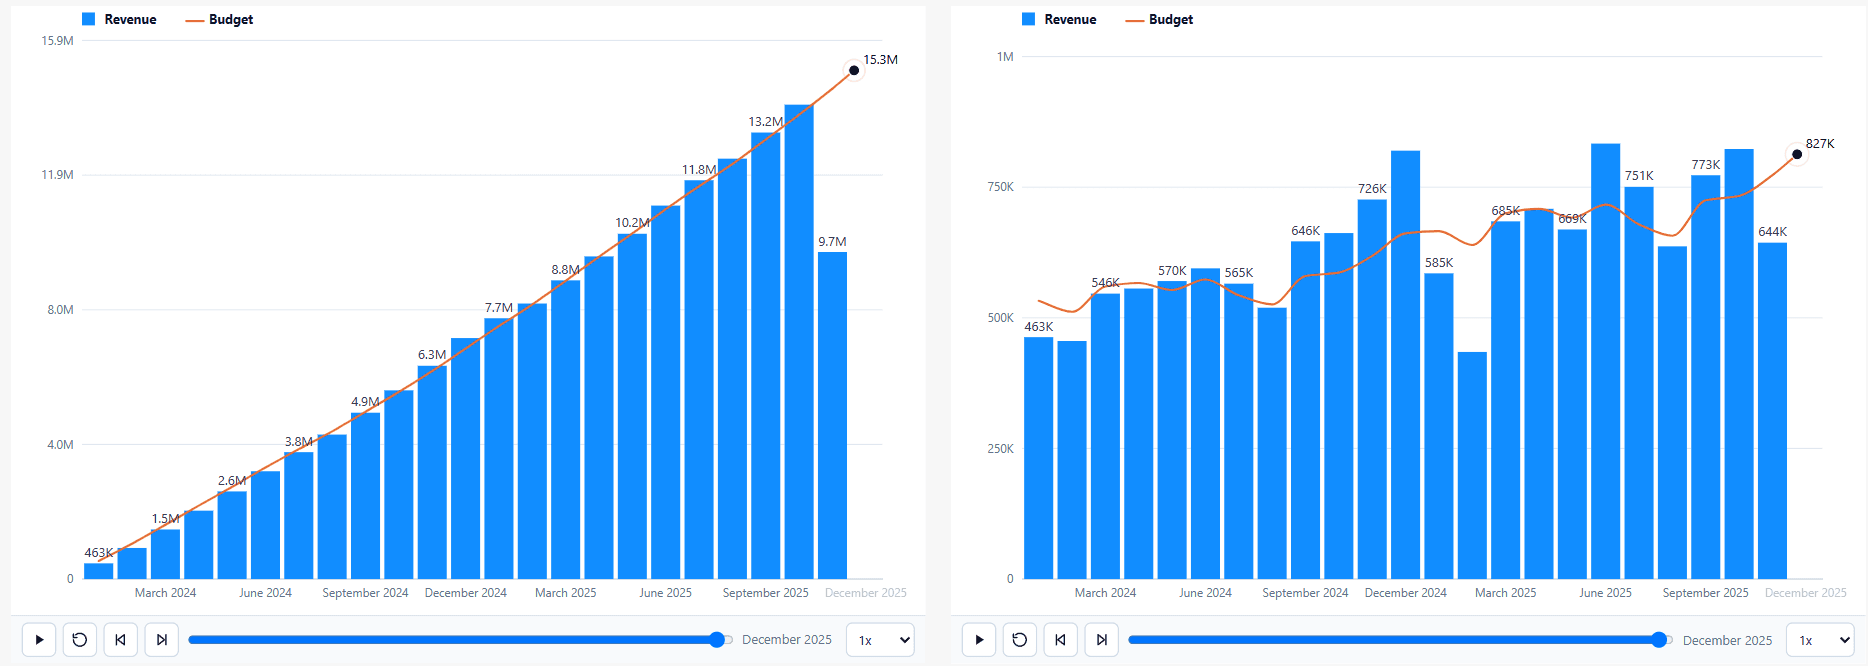
The default is Cumulative total, because the usual source for an animated chart is a per-period flow and adding the periods up is what makes a race a race. Sales made this month, sessions this day, revenue this quarter — these are flows, and a running total of them is meaningful.
Most business data is not that. A subscriber count, a headcount, a stock level or a balance is a stock: it already says what the total is right now. Adding March to February restates it, and a running total of positive numbers can only ever grow, so a genuine decline shows as a climb.
Two consequences worth knowing
Cumulative flattens variance. A cumulative actual against a cumulative budget will track each other almost exactly, because the misses and the beats cancel out. Any chart whose point is a comparison against a target belongs on Current value.
Cumulative does not reset each January. It accumulates from the first period in the data. There is no year-to-date mode.