Ataytis Motion
History charts
Line and area, line and column, and splitting a line chart into one panel per series.
Line / area
Animated line or layered area histories for a stable set of series. The line draws itself forward through the axis rather than appearing complete, so the shape of the history arrives in the order it happened.
The Line values well takes up to eight measures, each drawn as its own line and formatted independently.
Line and column
Category columns with an animated line measure over them, on a shared axis or a secondary one. The usual pairing is a volume on the columns and a rate on the line.
Small multiples
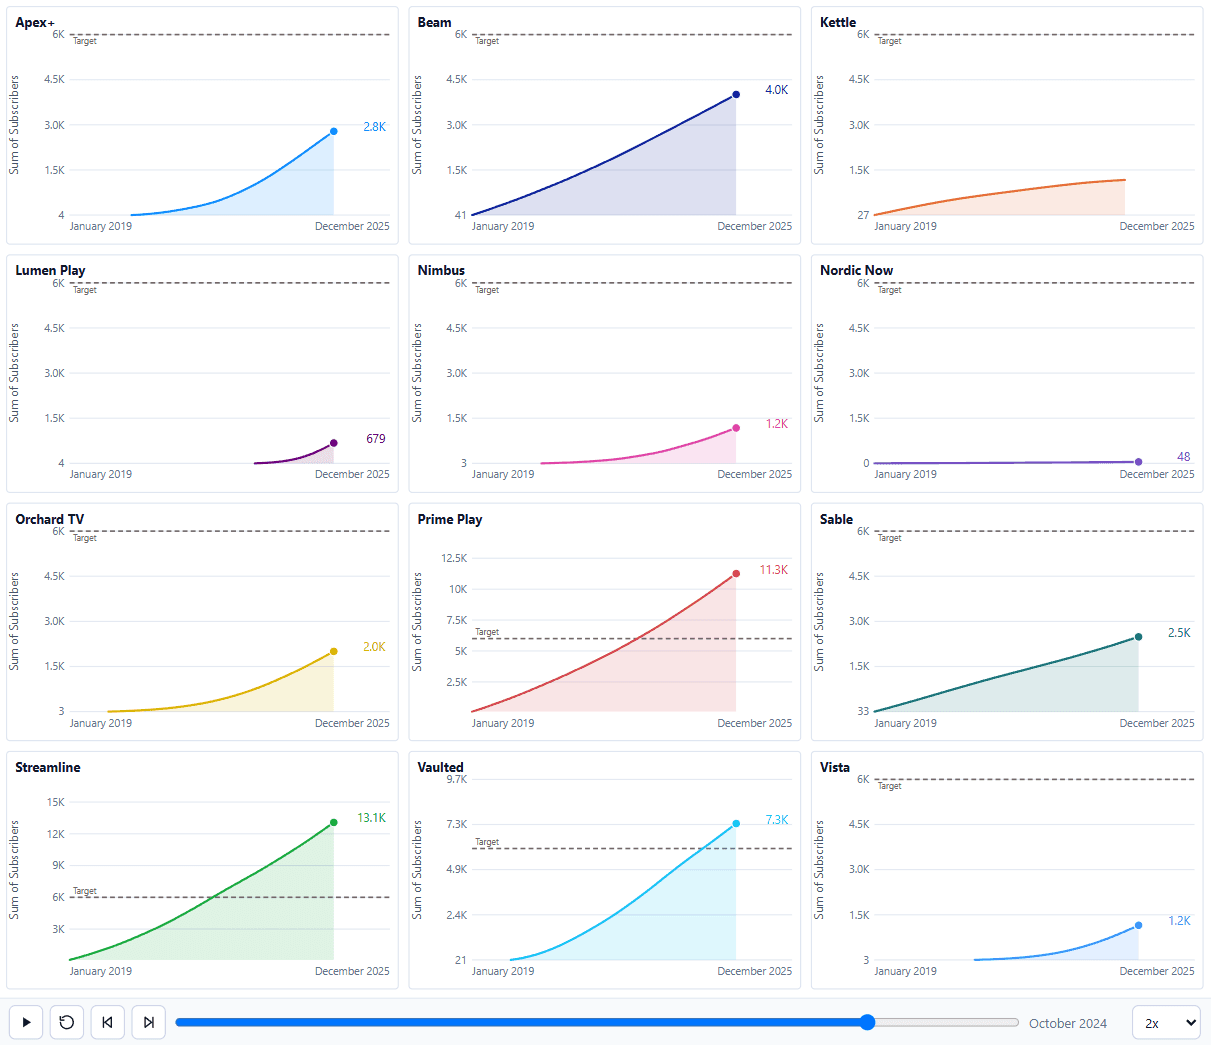
Line / area can be split into one panel per series, all animating on the same playhead. Each panel can share the scale with the others or use its own.