









Ataytis Motion
Field wells
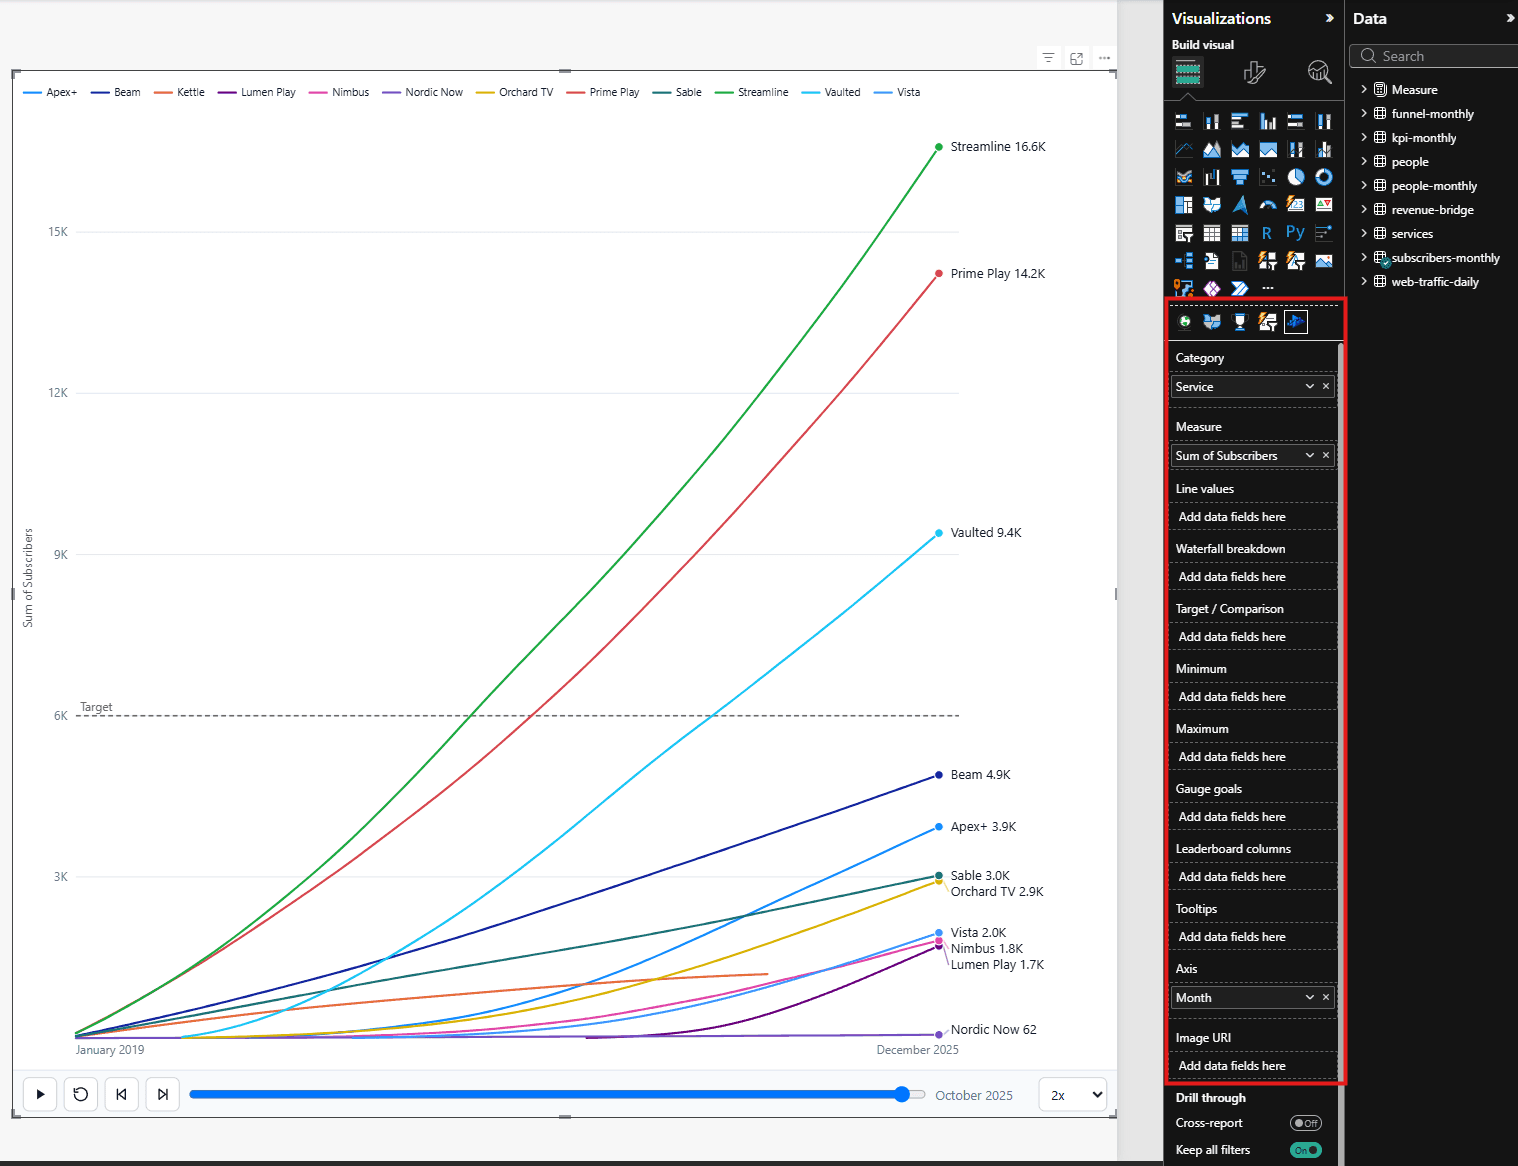
The twelve wells the visual reads, what each accepts, and how many fields it takes.
The twelve wells
Only Category and Measure are needed to draw most charts, and Axis to animate them. The rest are there for specific chart types and specific jobs.
| Well | Accepts | Max | What it does |
|---|---|---|---|
| Category | Grouping | 1 | The series, stage or category being compared. Leave empty for a standalone Gauge. |
| Measure | Measure | 1 | The value the chart encodes. |
| Axis | Grouping | 1 | The field the animation steps through. Usually a date or period. |
| Line values | Measure | 8 | Repeatable measures drawn as lines on Line / area and Line and column. |
| Target / Comparison | Measure | 1 | A target or comparison, used by target overlays and comparison charts. |
| Minimum | Measure | 1 | Lower bound for Gauge, error bars, or a data-driven axis floor. |
| Maximum | Measure | 1 | Upper bound for the same. |
| Gauge goals | Measure | 4 | Repeatable goals marked on the gauge arc, in field order. |
| Leaderboard columns | Measure | 16 | Repeatable measures shown as extra columns on the Leaderboard. |
| Waterfall breakdown | Grouping | 1 | Splits each waterfall category into individually selectable contributions. |
| Image URI | Grouping | 1 | A per-category image, as an inline data URI. |
| Tooltips | Grouping or Measure | 10 | Extra fields shown on hover. |
Fields from more than one table
If the Category and Image URI come from a dimension table and the Measure from a fact table, create a one-to-many, single-direction relationship between them in Model view.