









Ataytis Motion
The advanced editor
Where the settings live, how the seven tabs are organised, and how a configured design travels with the report.
Opening the editor
Ataytis Motion does not use the Power BI format pane for anything except data colours. Everything else lives in a full-screen editor, opened through the visual's own Edit entry.
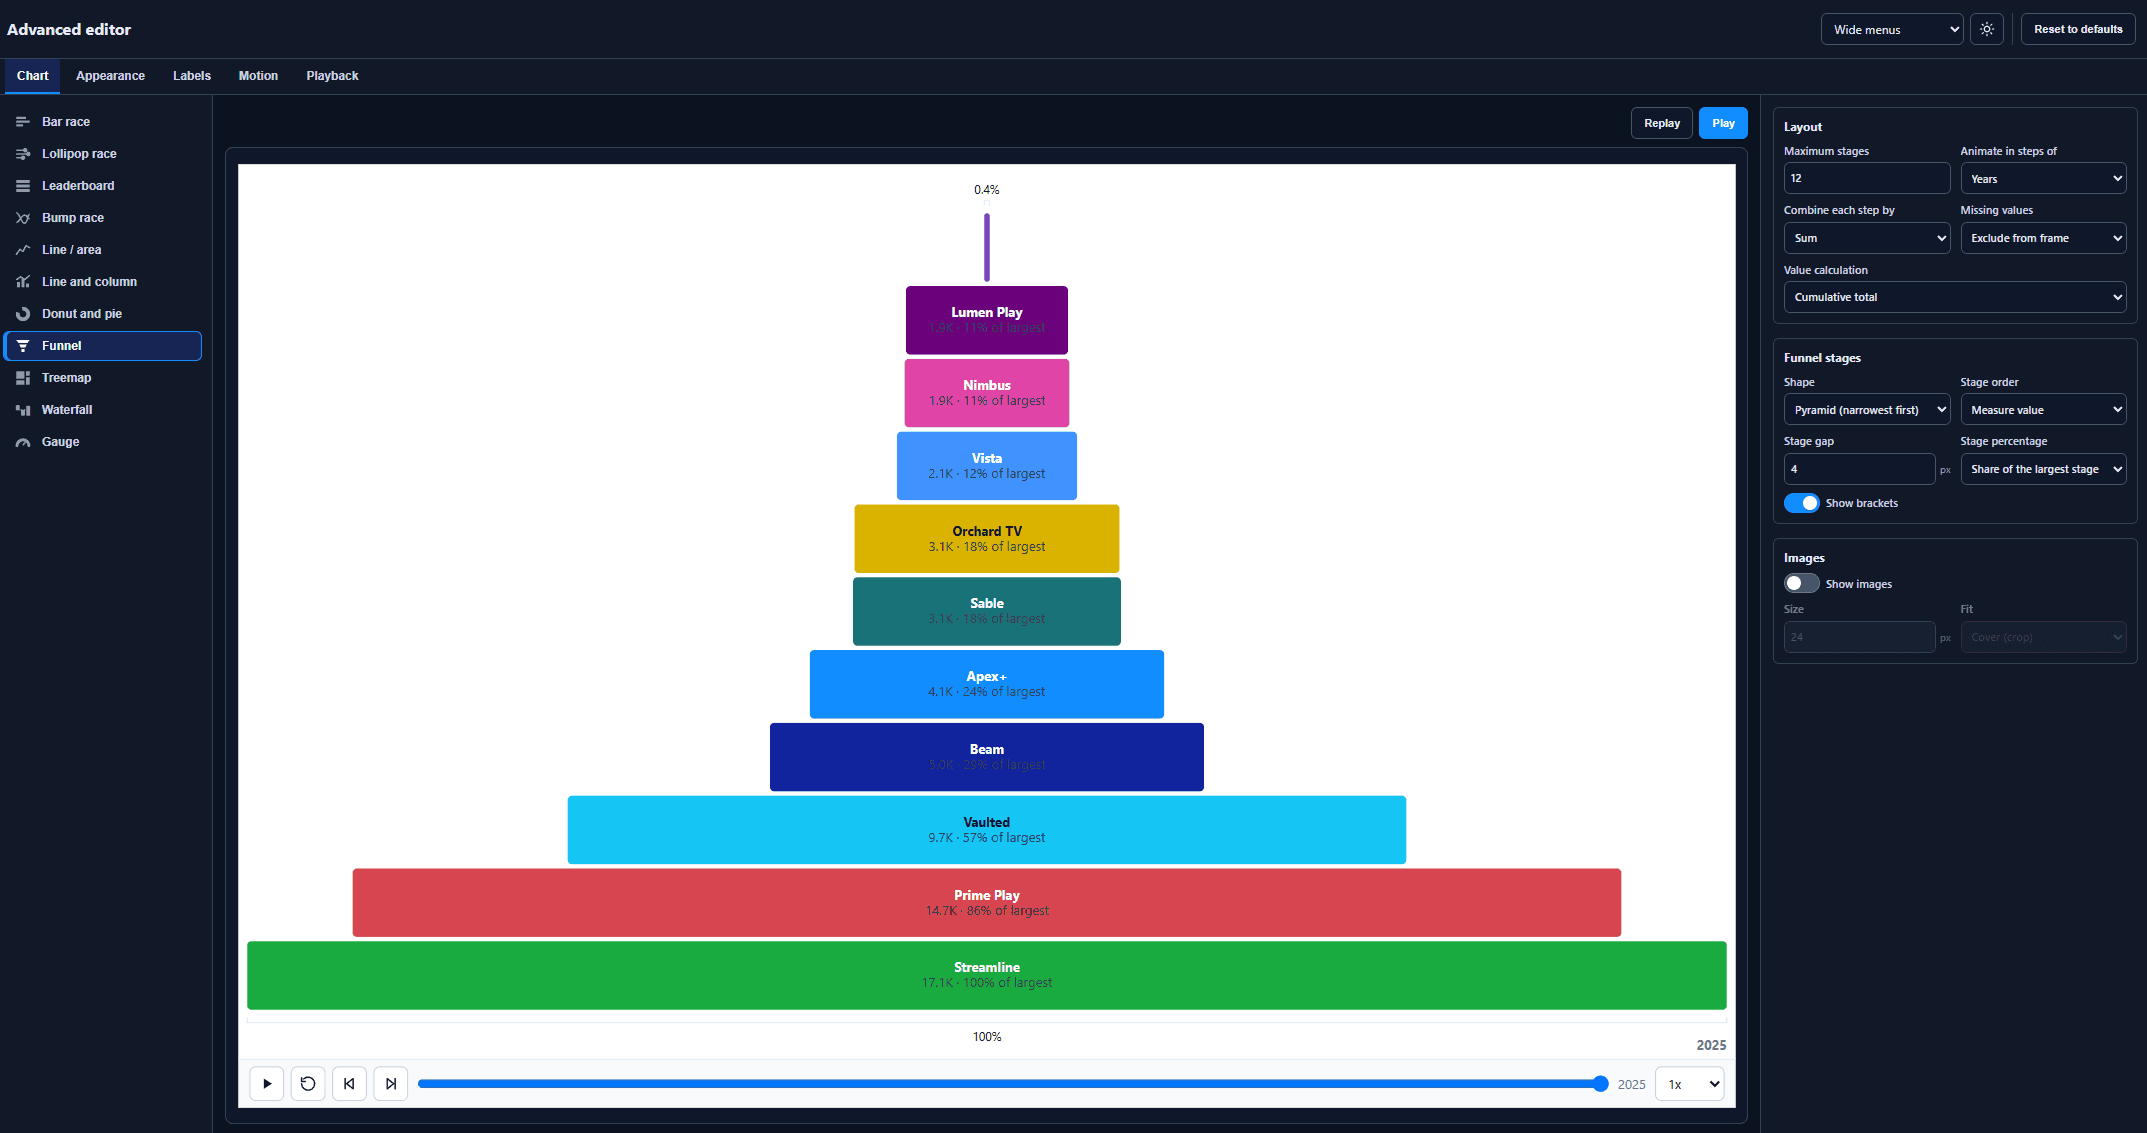
The seven tabs
| Tab | Contains |
|---|---|
| Chart | Chart type, layout, how many categories, sorting, chart-specific settings. |
| Appearance | Colour palette, per-category colours, images, plot-area image, canvas. |
| Labels | Category labels, value labels, legend, frame caption, number formatting. |
| Axes | Value axis, category axis, timeline labels, gridlines, tick spacing, zoom sliders. |
| Motion | Timing, easing, what moves and how fast. |
| Playback | Transport controls, speed, loop, autoplay, frame range, static export. |
| Analytics | Constant line, statistical lines, target analysis, annotations. |
The preview in the centre is driven by the data actually bound to the visual and uses the same renderer the report uses, so what you approve in the editor is what the report draws.