Ataytis Motion
Chart layout and sorting
How many categories are drawn, the order they are drawn in, and the orientation of the plotted charts.
How many categories are shown
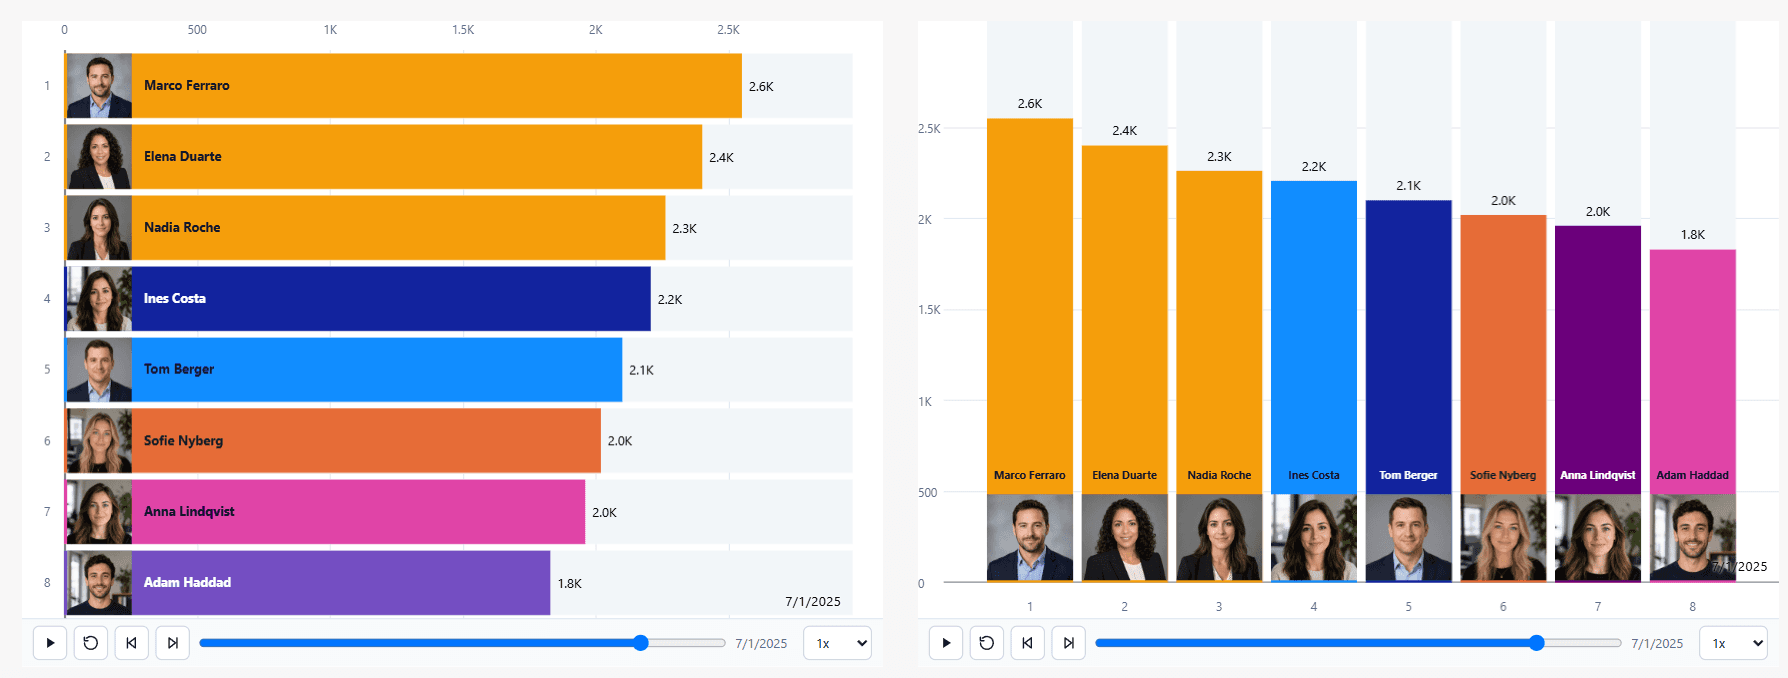
The Chart tab sets how many categories are on screen at once. Categories outside that number are not drawn, but they remain part of the ranking, so one can enter and leave the visible set as the animation runs.
Sorting
Ranking charts sort by the measure, recomputed at every frame, which is what produces the reordering. The composition charts and the funnel each have their own order.
| Chart | Order |
|---|---|
| Ranking charts | By the measure, descending, recomputed per frame. |
| Funnel | By value. Sorting ascending draws a pyramid rather than a funnel. |
| Waterfall | As loaded, or by category name ascending or descending. |
| Donut and pie | Slices hold their position for the whole run. |
Orientation
The plotted ranking and comparison charts draw horizontally or vertically. Horizontal suits long category names, because the label has the width of the canvas to sit in; vertical suits short names and a wide canvas.