Composition charts
Donut and pie, funnel, treemap and waterfall — showing how a whole divides and what builds it.
Donut and pie
Category shares around a centre hole. Setting the hole to zero gives a pie — they are one chart type, not two. Labels sit inside or outside and can show the category, the value, the percentage, or a combination.
Either the top N slices are shown with the remainder gathered into Others, or every category is drawn.
Which categories are named is decided per period, so the promised number of slices is honoured even before a late arrival has any data. A category entering the top N grows out of Others rather than appearing at full size.
Funnel
Stages ranked by value, showing drop-off and conversion between them. Sorting ascending draws a pyramid instead.
Treemap
Nested tiles sized by each category's share of the current period. Tiles resize as the axis advances, which suits a mix that shifts rather than a set of values that simply grow.
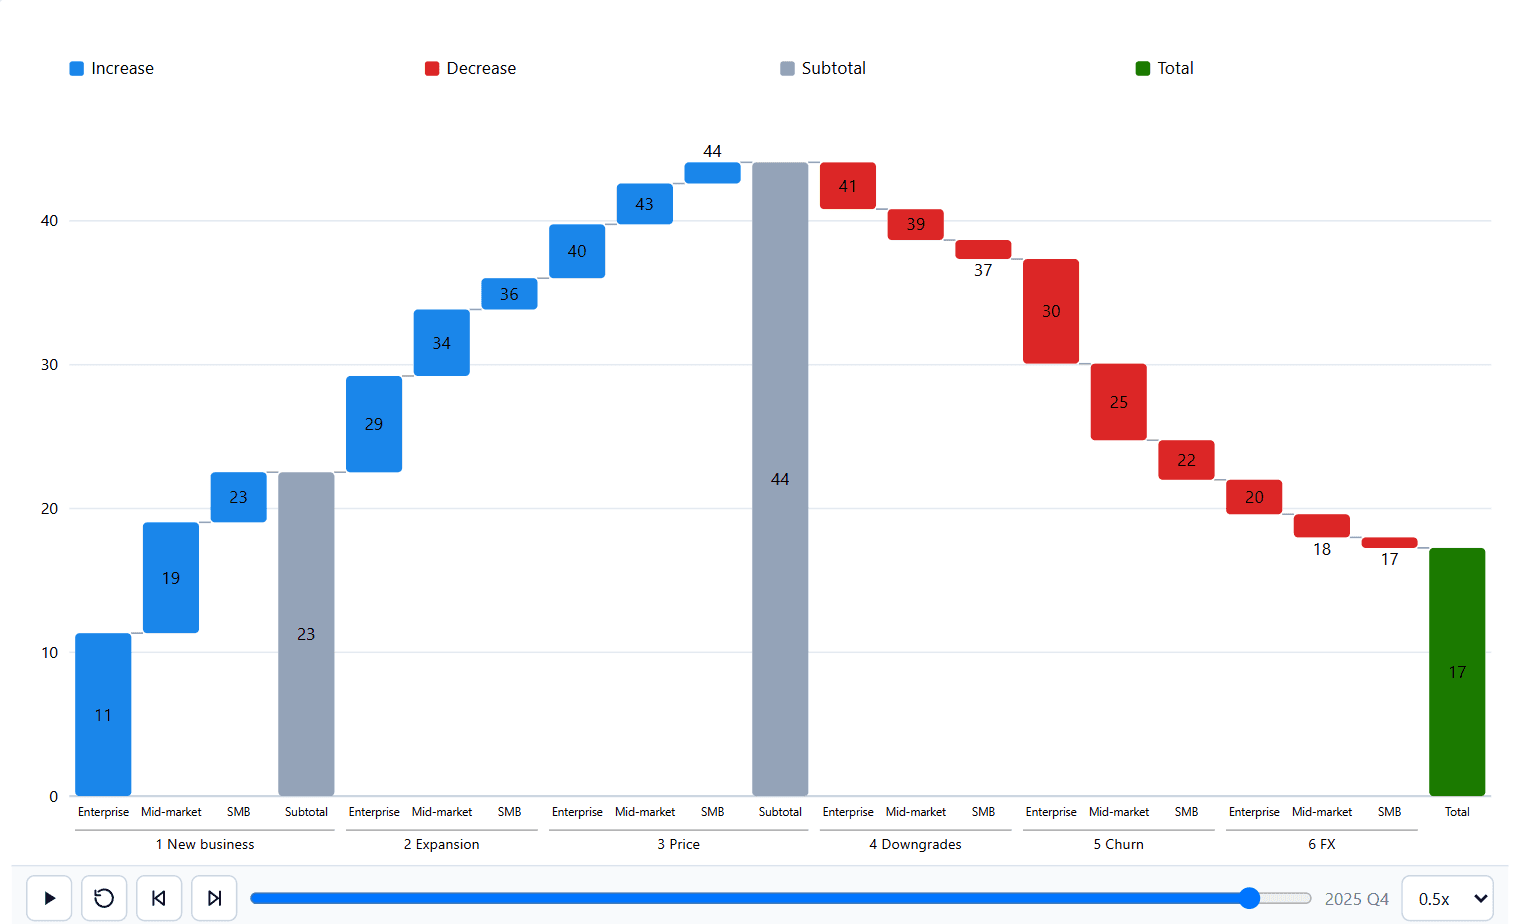
Waterfall
Signed contributions building from a starting value to an optional final total. A breakdown field splits each category into individually selectable contributions.
| Setting | What it does |
|---|---|
| Starting value | The figure the bridge builds from. Optional. |
| Starting column | Whether that figure is drawn as its own column. |
| Subtotals | A running total after chosen categories, not after all of them. |
| Final total | A closing column for the end figure. Optional. |
| Connectors | The lines joining one step to the next. Optional. |
| Step order | As loaded, or by category name ascending or descending. |