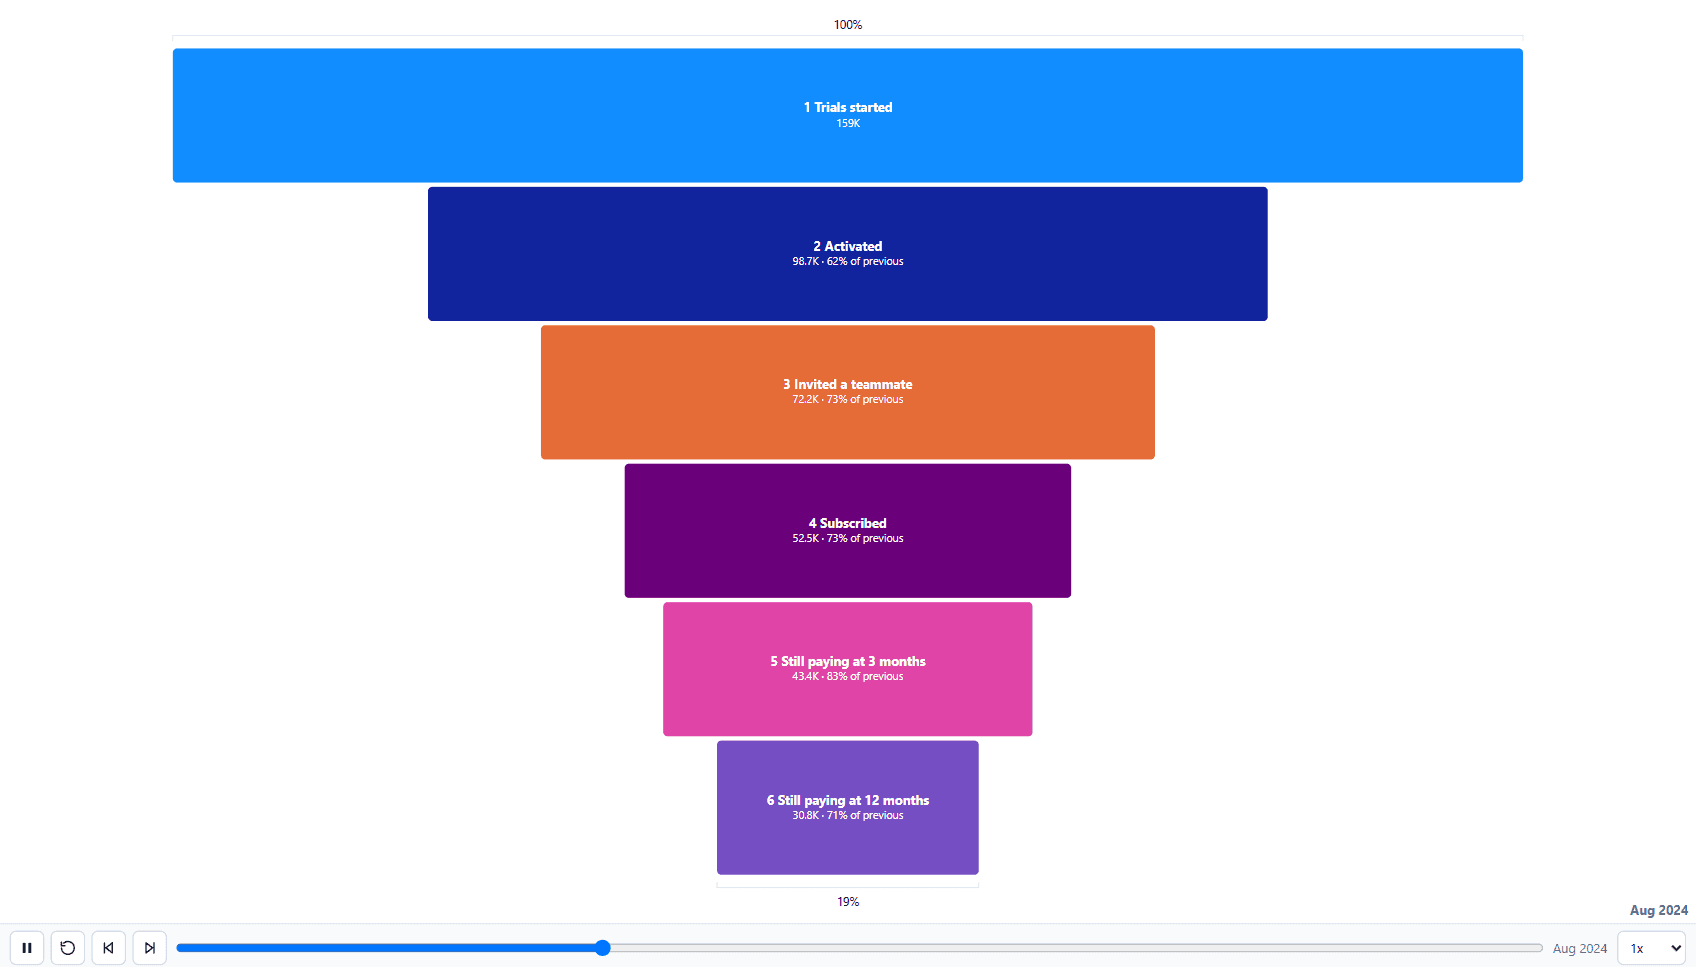
Labels, captions and formatting
Category labels, value labels, the frame caption, the legend, and how numbers are formatted across a chart.
Category labels
Category labels carry their own colour, size, weight and position. Where a name is longer than the room available, the label can truncate, wrap onto two lines, or shrink to fit on one.
| Overflow behaviour | What happens |
|---|---|
| Truncate | The name is cut and ellipsised. |
| Wrap | The name runs onto a second line. |
| Auto-fit | The text size drops until the name fits on one line. |
A category-positioned image can optionally replace the category text, which suits a set of competitors identified by a logo or a flag more readily than by name.
Value labels
Value labels show the number a mark represents. They can also show what has changed since the previous frame, and how the value stands against a target.
- Rank movement since the previous frame.
- Value or percentage change from the previous frame.
- Variance against the Target / Comparison field, as an absolute number, a percentage, or both.
The frame caption
The frame caption names the period currently on screen. It can sit in any of the four corners, at a text size that responds to the canvas, in a colour of its own.
Legend and number formatting
The legend and number formatting are set on the same tab. Display units and decimal places apply across the chart, and on the Leaderboard they can be overridden per column.
| Limit | Value |
|---|---|
| Label text size | up to 96px |
| Axis text size | up to 48px |