









Introduction to Ataytis Motion
What Ataytis Motion is, the eleven chart types it contains, the fields it reads, and where its settings live.
What is Ataytis Motion?
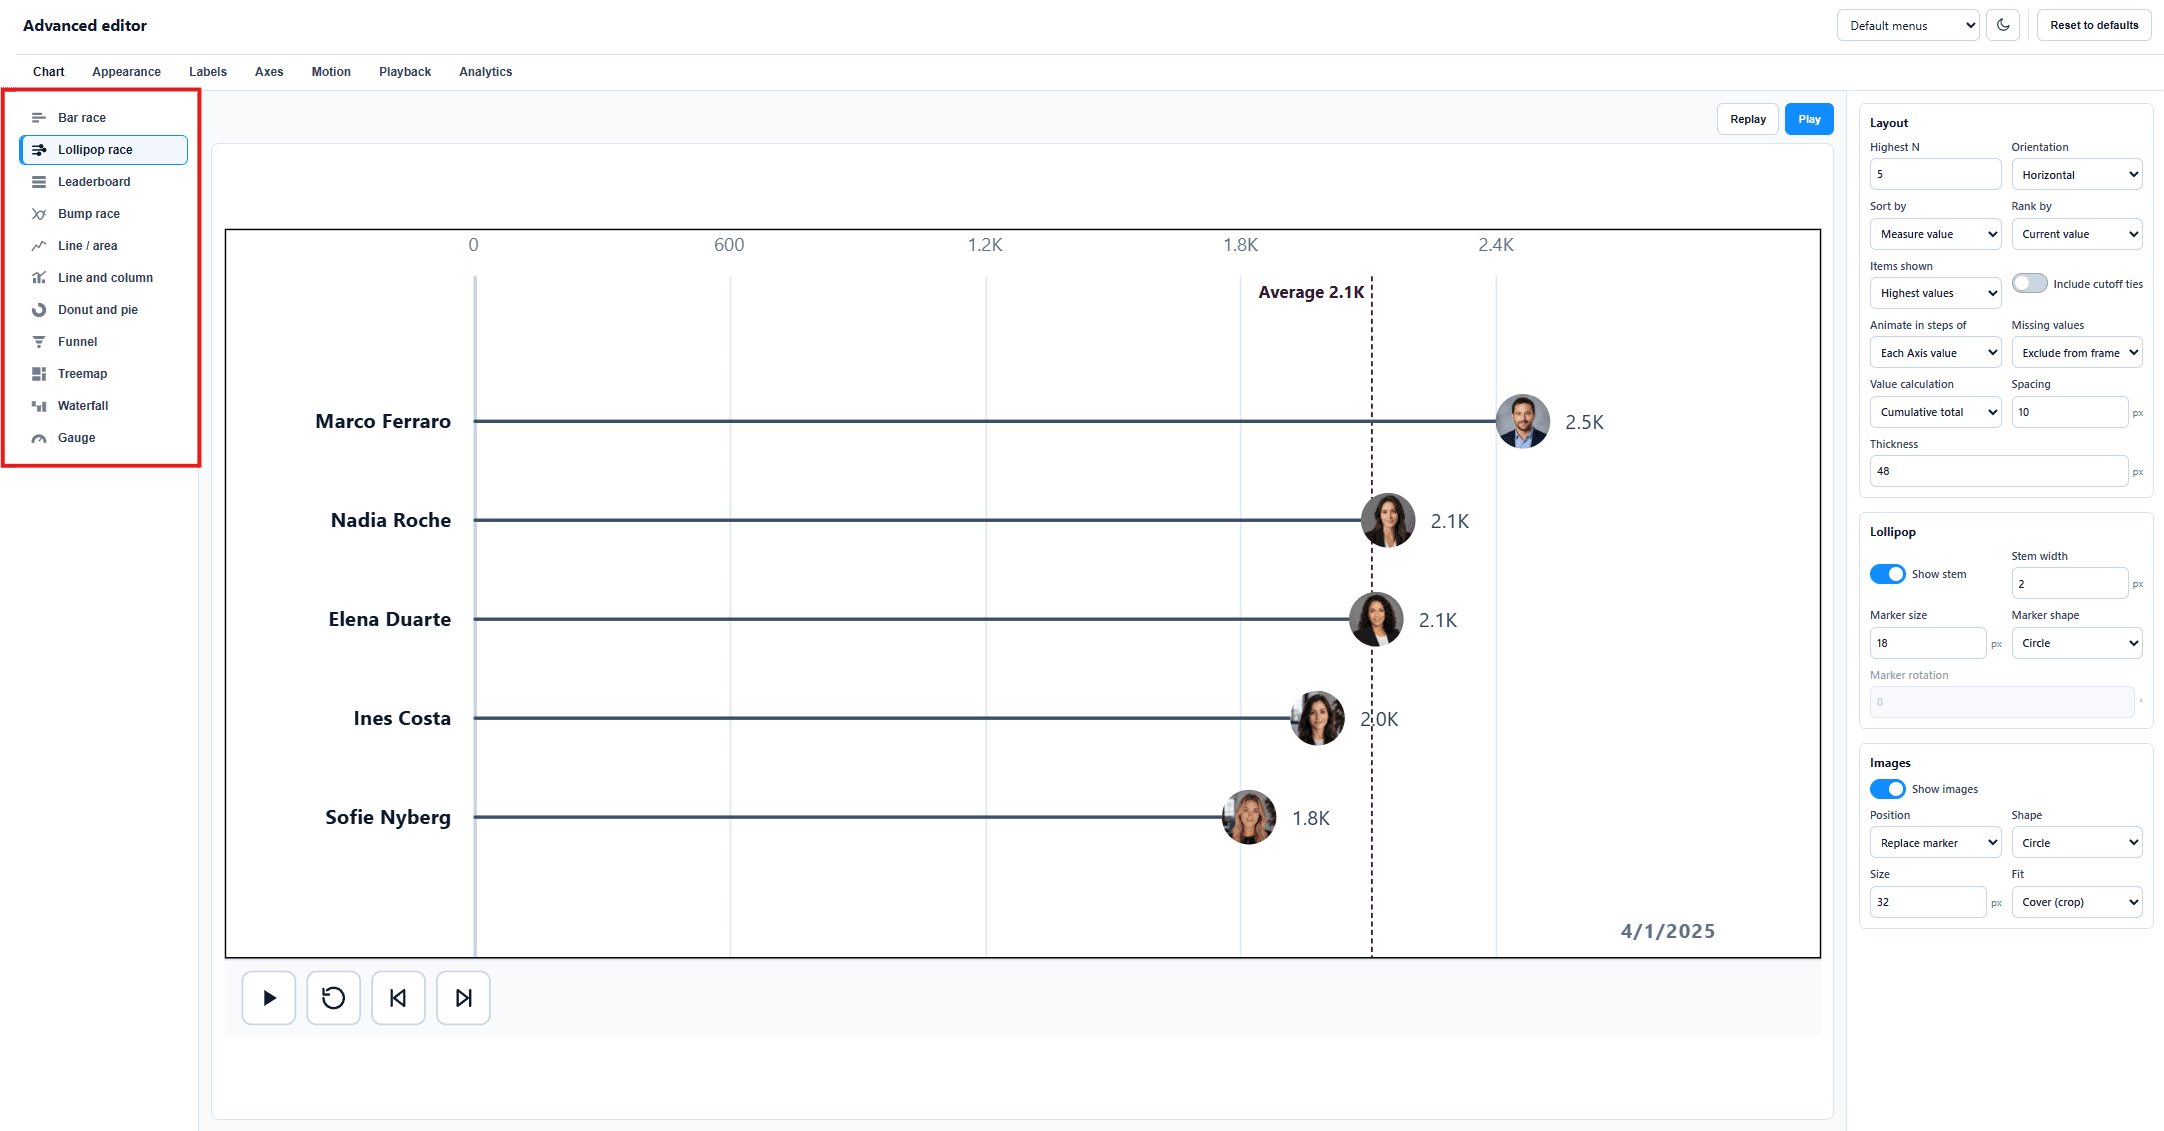
Ataytis Motion is a Microsoft-certified Power BI custom visual containing eleven chart types, each of which animates through a period field. One visual is installed; the chart type is a setting inside it.
Everything except data colours is configured in a full-screen editor rather than the Power BI format pane. The design is stored as JSON inside the report, so a configured visual can be copied between pages and reports and arrives with its settings intact.
The eleven chart types
| Chart | What it is for |
|---|---|
| Bar race | Ranked bars that resize and reorder as the axis advances. |
| Lollipop race | Ranked markers with an optional stem. A lighter alternative to bars. |
| Leaderboard | Ranked rows with movement indicators instead of a plotted scale. Reads as a table. |
| Bump race | Rank over time as crossing lines. Position, not magnitude. |
| Line / area | Animated line or layered area histories for a stable set of series. |
| Line and column | Category columns with an animated line measure over them, on a shared or secondary axis. |
| Donut and pie | Category shares around a centre hole. Set the hole to zero for a pie. |
| Funnel | Stages ranked by value, showing drop-off and conversion. Sort ascending for a pyramid. |
| Treemap | Nested tiles sized by each category's share of the current period. |
| Waterfall | Signed contributions building from a starting value to an optional final total. |
| Gauge | One dial for the current measure, with optional minimum, maximum, target and up to four goals. |
What a chart needs
Most charts need two fields to draw and three to animate: a Category to compare, a Measure to size it, and an Axis field for the animation to step through. Everything else is optional.