Ataytis Motion
Annotations and analytics
Notes pinned to a moment in the animation, targets and variance, and reference lines that move with the data.
Annotations
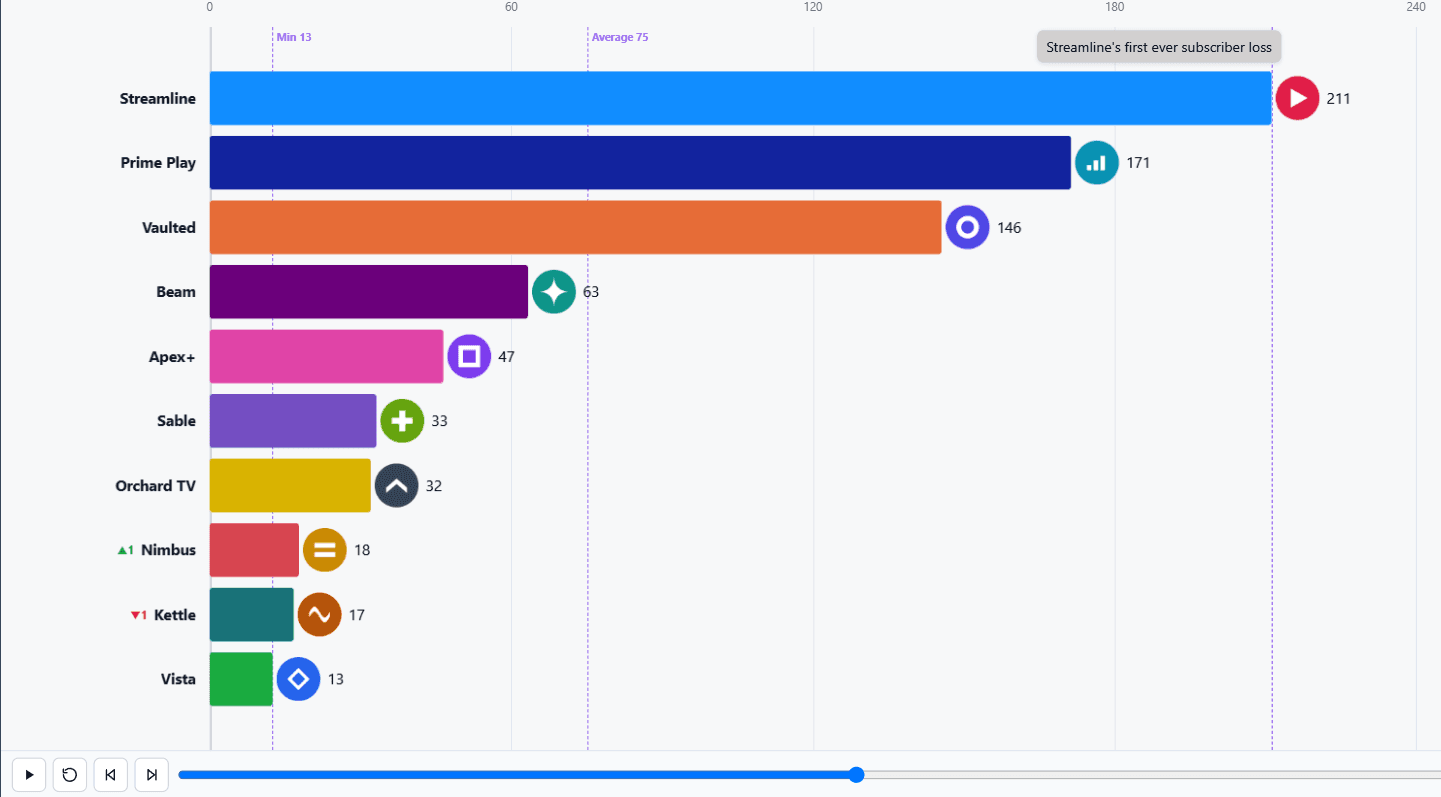
A note is pinned to a period and appears as the playhead reaches it, which is what turns a loop somebody watches once into an explanation of what happened.
| Setting | What it does |
|---|---|
| Span | How many periods the note stays, or keep until the end. |
| Hold | Playback pauses for a set number of milliseconds on reaching the note, so there is time to read it. |
| Position | Nine positions on the canvas, plus a manual offset. |
Targets and variance
A field in the Target / Comparison well draws a marker or line on any chart that supports it, with its own colour, style and width, and an optional key naming it.
Value labels can show the variance against that target as an absolute number, a percentage, or both.
Analytics lines
Constant line, average, median, minimum, maximum and percentile, each with its own colour, style, width and label. They recompute per frame, so they move with the data as the animation runs.