









Values
Number formatting, alignment, colours, alternating rows, in-cell charts, and the entry point to conditional rules, sparklines, and calculations.
Formatting one column at a time
Almost everything on this card can apply to the whole matrix or to a single column or row. Edit column / row chooses the target; the settings below then write an override for it. This is what lets a percentage column show one decimal place while the currency column beside it shows none.
| Setting | What it does |
|---|---|
| Decimal places | Decimal precision, per column where an override is set. |
| Display units | Thousands, millions, and so on. |
| Display as | Renders the value as a number or a percentage. |
| Let report viewers invert sign | Allows readers to flip the sign themselves — useful for cost lines that are stored negative but read better positive. |
| Right-click headers to invert sign | Exposes that inversion through the header context menu. |
| Negative values | Either a minus sign (-1,234) or accounting-style parentheses ((1,234)). |
| Blank values | What appears where there is no value: Default, Dash, Zero, N/A, or Custom text. |
| Custom blank text | The text used when Blank values is set to Custom text — anything you like, including a single space to leave the cell empty. |
| Font, Value alignment, Wrap values | Type and placement inside the cell. |
| Text color and Background | Cell colours. |
| Alternating rows, Alternate text color, Alternate background | Zebra striping and the colours it uses. |
Signs, negatives, and empty cells
Three settings decide how a number reads, and between them they resolve most of the friction in a financial or operational table.
- Negatives can show as a minus sign or in parentheses. Parentheses are the accounting convention and are easier to scan down a column, because the bracket is wider than a minus.
- Blanks are distinct from zeros, and the difference usually matters. A missing figure and a genuine nil are not the same claim, so choose Dash for one and Zero for the other rather than letting both fall through to Default.
- Sign inversion flips the displayed sign without touching the model. Cost and liability measures are often stored negative and read better positive; Let report viewers invert sign hands that choice to the reader, and Right-click headers to invert sign puts it in the header context menu.
In-cell charts
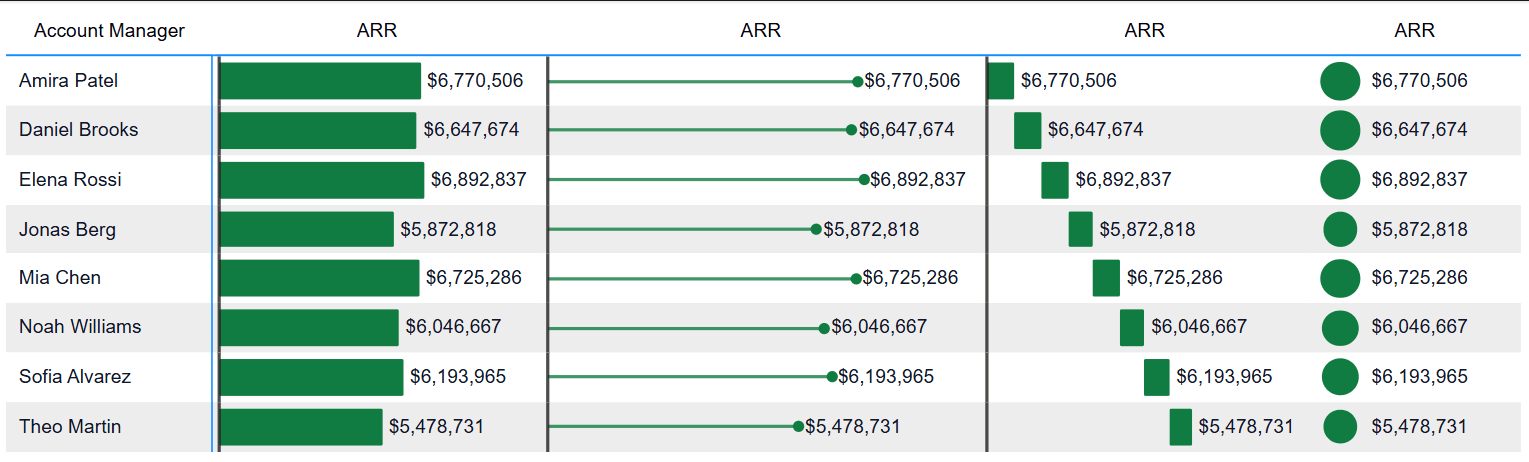
A value column can be drawn as a chart instead of, or alongside, its number. The chart is drawn in the cell at the width of the column, so the shape of the data reads without the reader interpreting the digits.
| Setting | What it does |
|---|---|
| Show as | Number, Bar, Waterfall, Pin, Dot, Diverging bar, or Diverging pin. The diverging forms draw from a centre line, which suits values that go both ways. |
| Value | Whether the number is shown next to the chart. |
| Sticky Value | Keeps that number pinned in place as the chart scales. |
| Positive color, Negative color, Neutral color | Colours applied by the sign of the value. |
| Negative below and Positive above | The thresholds where those colours take over. |
| Show chart at level 1 – 6 | Which hierarchy levels draw the chart. Charts on every level of a deep hierarchy usually read as noise, so restrict them to the levels that matter. |
Conditional rules, sparklines, and calculations
The bottom of the Values card opens the advanced editor, where conditional formatting rules, sparkline configuration, and calculated rows and columns are defined. Those have their own pages: see Conditional formatting, Sparklines, and Calculations.