









Toolbar
Choose which tools report readers get — search, export, comments, notes, annotation, quick calculations, grouping — and style every button.
You decide what readers can do
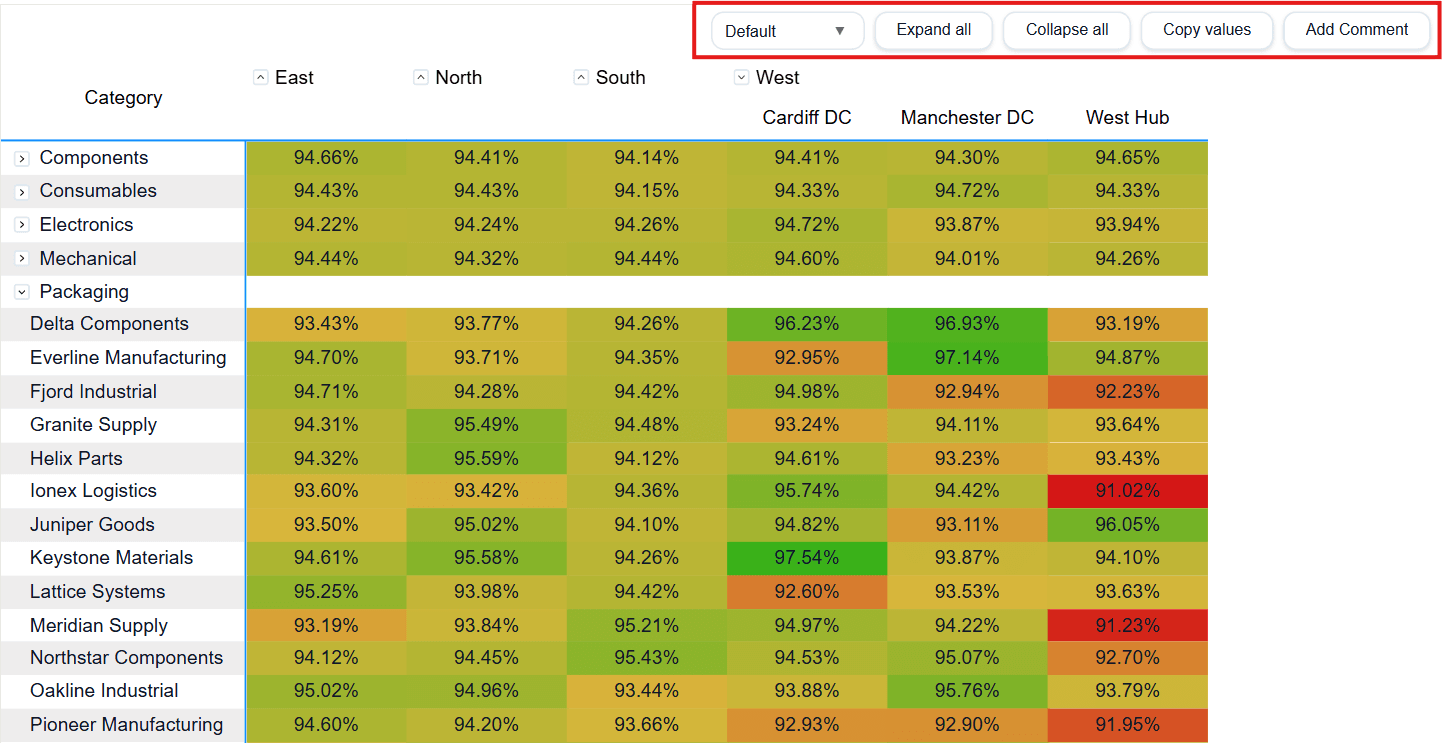
The toolbar is the visual's interface for report readers, and it is entirely opt-in. Every button is switched on individually, and each carries its own text, icon, position, size, corner radius, font, colours, and borders. A report published with search and export gives readers exactly those two things; nothing else appears.
Row search
Search filters the matrix to rows matching what the reader types. It is the single most useful tool on a long table.
| Setting | What it does |
|---|---|
| Show search target selector | Lets readers choose which field they are searching. |
| Target selector hint | Helper text explaining that selector. |
| Show clear button | Adds a control to reset the search. |
| Search up to rows | How many rows are searched. Zero searches everything currently loaded. |
| Placeholder text | The prompt shown in the empty search box. |
| Search box width / height / corner radius / font | Sizing and type for the box. |
| Background, border, border width, text color, placeholder color | Appearance of the search box. |
| Target selector width, Clear button text | Sizing and labelling for the two sub-controls. |
Result count
A counter showing how many rows are loaded and how many exist in total, so a reader is never misled by a partially loaded matrix. Loaded rows and Total rows each have their own label and position, with a separator between them, plus the usual font, colour, sizing, and border controls. Total rows uses the measure in the Total rows field well.
Export and copy
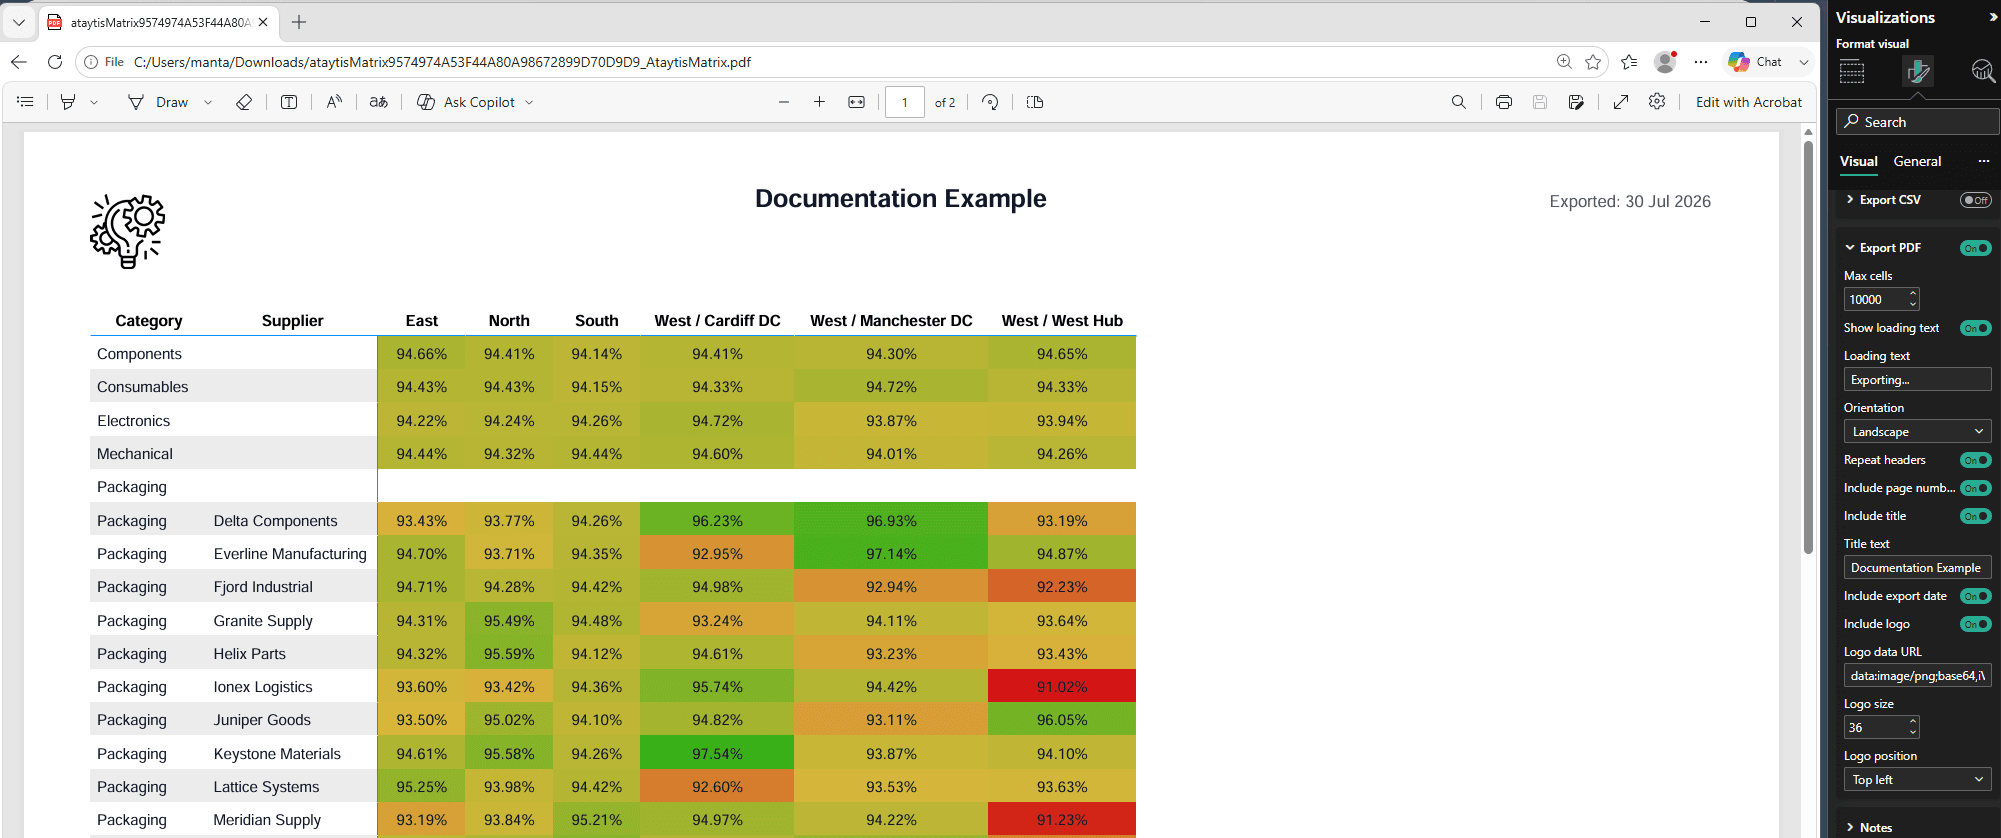
Four ways out of the visual. Copy values puts the matrix on the clipboard so it can be pasted straight into Excel, an email, or a document — no file, no download, and no dependency on tenant download policy. The three export formats each write a file, and each has its own button and settings group: XLSX and PDF carry the visual's formatting and number formats through, while CSV is there for when someone just wants the values.
| Action | Produces | Keeps formatting |
|---|---|---|
| Copy values | Clipboard content, pasteable anywhere | Values and structure |
| Export XLSX | An Excel workbook | Yes — styling and number formats |
| Export CSV | A plain comma-separated file | No, by design |
| Export PDF | A paginated document | Yes — styling, number formats, and layout |
| Setting | Applies to | What it does |
|---|---|---|
| Max cells | All three | Caps how much is written in one export. |
| Show totals | All three | Whether subtotal and grand total rows are included. |
| Show loading text / Loading text | All three | Feedback while a large export is being assembled. |
| Orientation | Portrait or landscape. | |
| Repeat headers | Repeats column headers on every page. | |
| Include page numbers | Numbers the pages. | |
| Include title / Title text | A heading on the exported document. | |
| Include export date | Stamps the document with the date it was produced. | |
| Include logo | Switches the logo on. | |
| Logo data URL | The image itself, supplied as a base64 data URL rather than a file path or web address — see the note below. | |
| Logo size | How large the logo is rendered on the page. | |
| Logo position | Top left, Top right, Bottom left, or Bottom right. |
Notes, comments, highlighting, and annotation
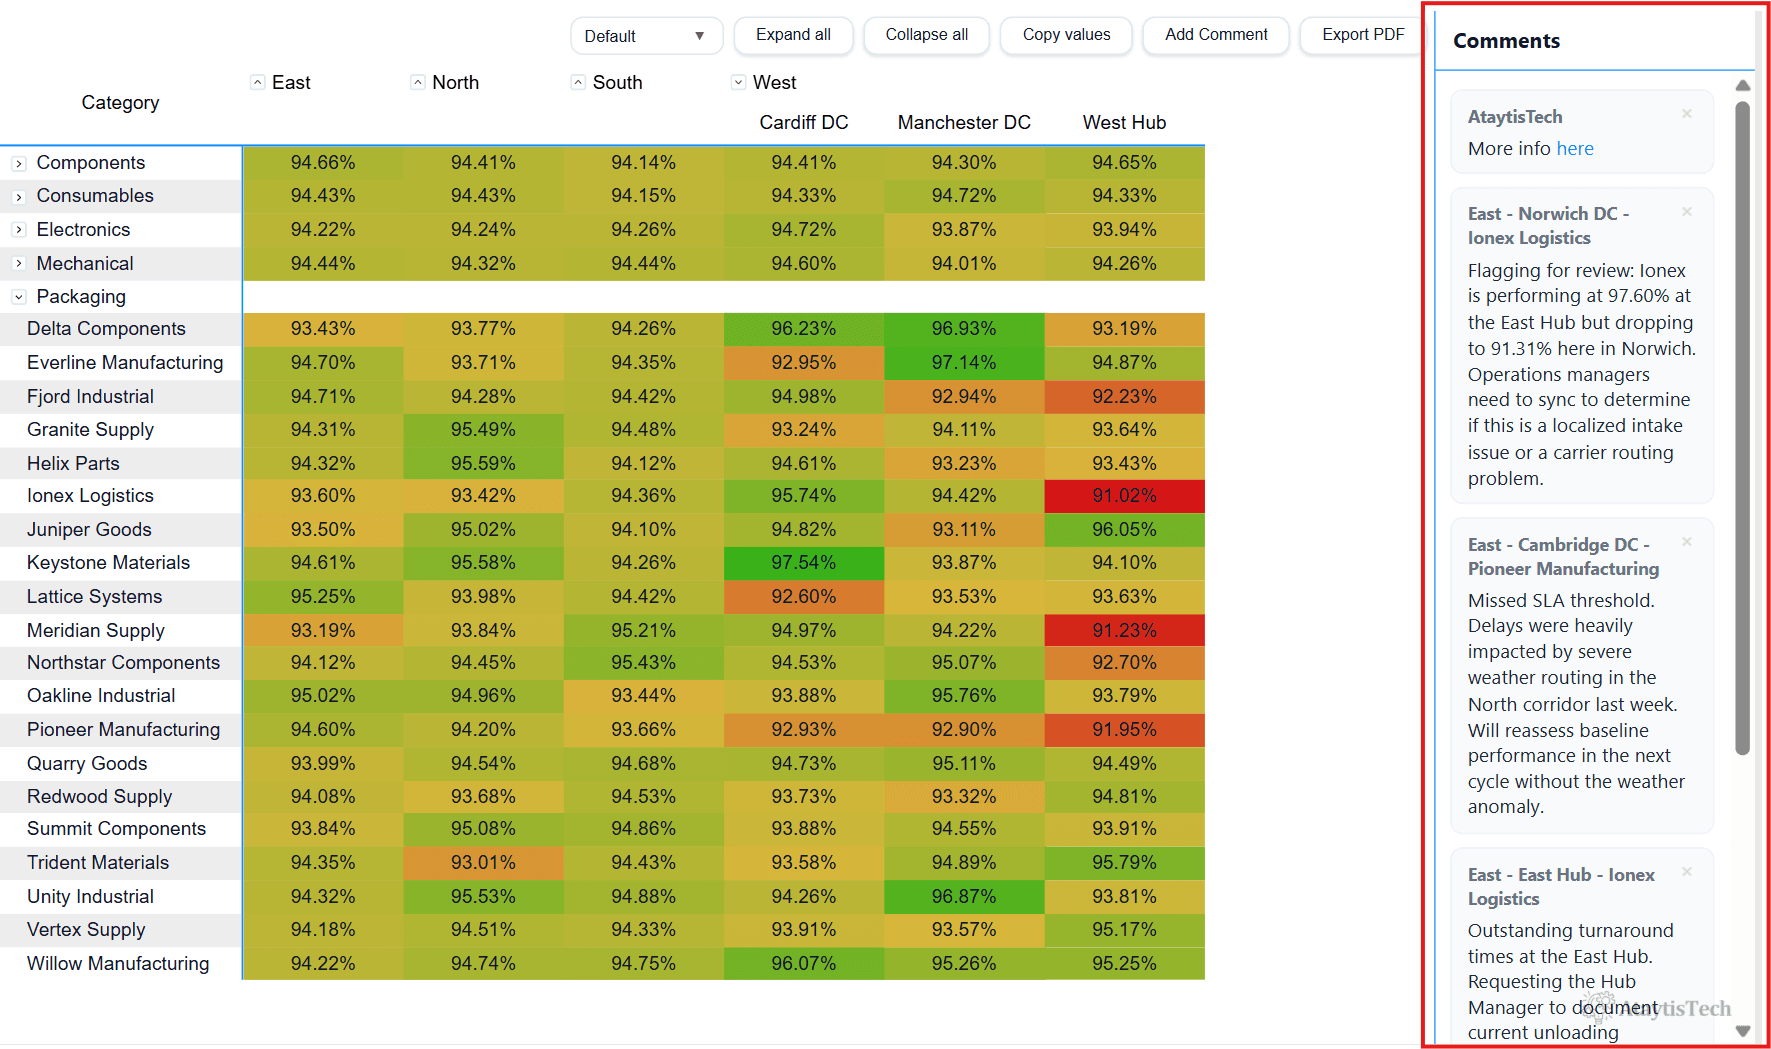
Four related tools let readers record why a number is what it is, rather than losing that context in email.
| Tool | What it provides |
|---|---|
| Notes column | An extra column readers type free text into, switched on with Show notes column. It has its own title, width, styling, and can sit to the Left or Right of the matrix. Use it for the one-line explanation that would otherwise be lost. |
| Comments panel | A side panel holding threaded comments against the matrix. Fully configurable — its position, size, colours, fonts, and the variance icon it shows (Triangle, Arrow, Chevron, Circle, or none) are all settings, so it can sit wherever suits the report layout. |
| Highlight | Lets readers mark individual cells to draw the eye, without changing any data. |
| Annotation | Freehand pen and highlighter drawing over the visual, which works in the Power BI Service as well as Desktop. |
What persists, and what does not
This is the part worth understanding before you rely on these tools, because notes and annotations behave differently depending on where they were made.
| Where it was added | What happens to it |
|---|---|
| In Power BI Desktop, then published | Saved with the report. Every reader sees it, exactly as authored. |
| In the Power BI Service, in edit mode, then saved | Saved with the report in the same way. This is how you add a note that needs to stick without reopening Desktop. |
| In the Power BI Service, in reading view | Available for that session only. The reader can add, use, and see it, but it is gone when they leave. |
Quick calculations, grouping, and the rest
| Tool | What it provides |
|---|---|
| Quick calculations | A menu of calculations readers can apply themselves. Like every other button, it can be hidden from readers entirely. |
| Grouping | Collects several toolbar buttons behind one control, so a busy toolbar stays tidy. Each button can be given its own button or placed in one of up to six menus, and the menu marker can be a Chevron, Triangle, Plus, Dots, or nothing. |
| Density picker | Lets readers switch between Compact and Comfortable row spacing themselves. |
| Expand/collapse | Buttons to expand or collapse the whole hierarchy at once, each with its own label. |
| Copy button | Copies the matrix to the clipboard, which is the fallback when tenant policy blocks downloads. |
The Button styling group sets defaults for every button at once. The Layout group places the toolbar at the Top, Bottom, Left, or Right of the visual, aligns the buttons within it (Left, Center, Right, or Space between), and spreads them across up to six rows. Toolbar options carries the remaining toolbar-wide switches. Individual buttons keep their own overrides, so you can set a house style and then make one button deliberately different.
Every button also takes an icon from a shared set — copy, export, download, share, note, comment, edit, annotate, highlight, calculator, percent, sort, filter, search, and others — positioned Left of text, Right of text, Icon only, or omitted.