Calculations
Add calculated rows and columns with formulas, hide working rows, and order the result — without changing the model.
Calculations inside the visual
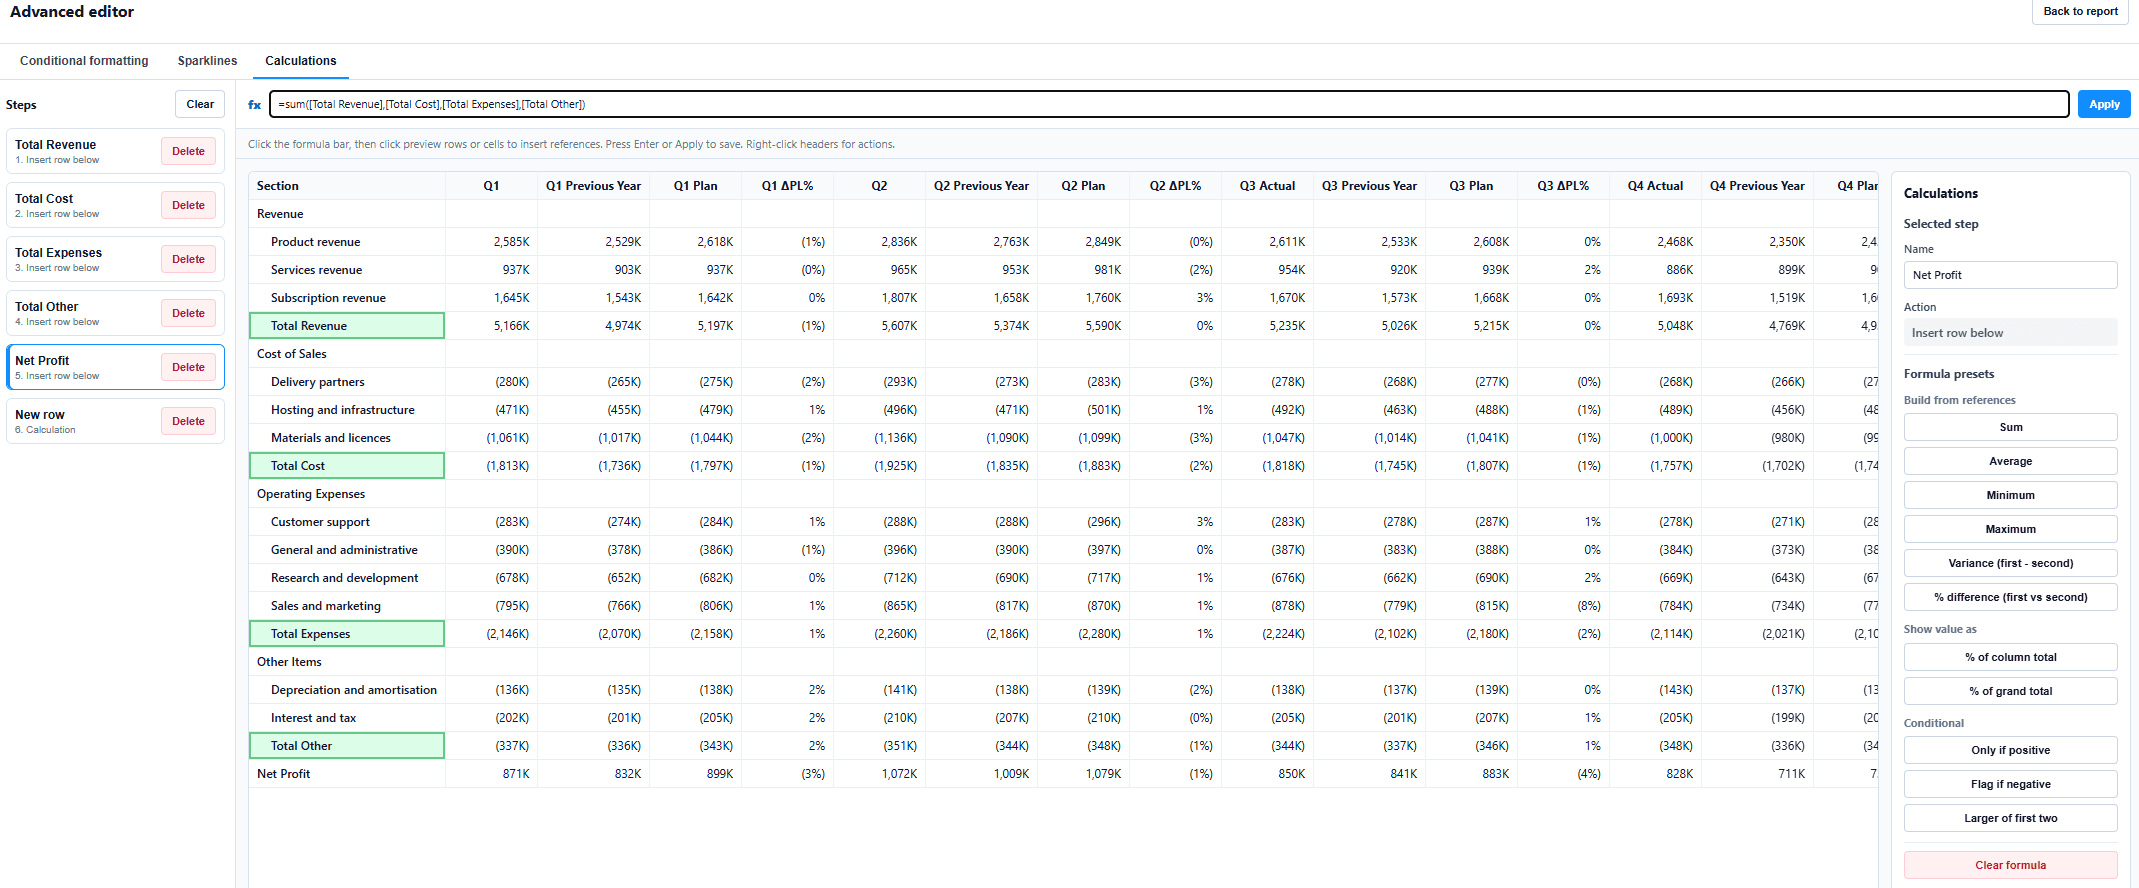
Some rows exist only for one report: a subtotal across a handful of specific line items, a ratio between two of them, a reordering that suits one audience. Adding a measure to the semantic model for each of those is heavy, and often needs someone else to do it. The calculations view lets you define them in the visual instead.
Working in the calculations view
Open the advanced editor
From the bottom of the Values card, then choose the Calculations section.
Insert a row or column
Add a calculated row or column at the position you want it.
Give it a formula
Use the formula bar to define it. Formula presets cover the common shapes — sums, averages, differences, running totals, and share-of-total calculations.
Rename it
Calculated rows and columns can be renamed inline, and that name is what exports.
Hide the working
Rows and columns used only as intermediate steps can be hidden, leaving the result visible.
Order the result
Sort and position rows and columns however the report needs them, independently of the underlying data order.
Formula presets
Presets give you the common calculations without writing them from scratch, grouped by what they do.
| Group | Includes |
|---|---|
| Aggregates | Sum, average, minimum, maximum, and count over a chosen set. |
| Differences | Difference and difference percentage, including against the previous column. |
| Variance | Variance and variance percentage between two members. |
| Shares and cumulative results | Running totals, percentage of total, and percentage of ranked rows. |