









Get and install the visual
Add Ataytis Matrix from Microsoft Marketplace, start the free trial, and understand how licensing works in Desktop and the Power BI Service.
Before you start
- Use a current supported version of Power BI Desktop, signed in with your report-development account.
- Confirm your organisation permits visuals from Microsoft Marketplace. Tenant administrators can restrict AppSource or custom visuals entirely.
- Make sure you can edit the report and add visuals to its canvas.
Install from Microsoft Marketplace
Open the visual gallery
In Power BI Desktop, open the Visualizations pane and choose to get more visuals. Depending on your version this sits under an ellipsis menu or appears as Get more visuals.
Open Microsoft Marketplace
Choose the Microsoft Marketplace or AppSource view so Power BI searches published visuals rather than local files.
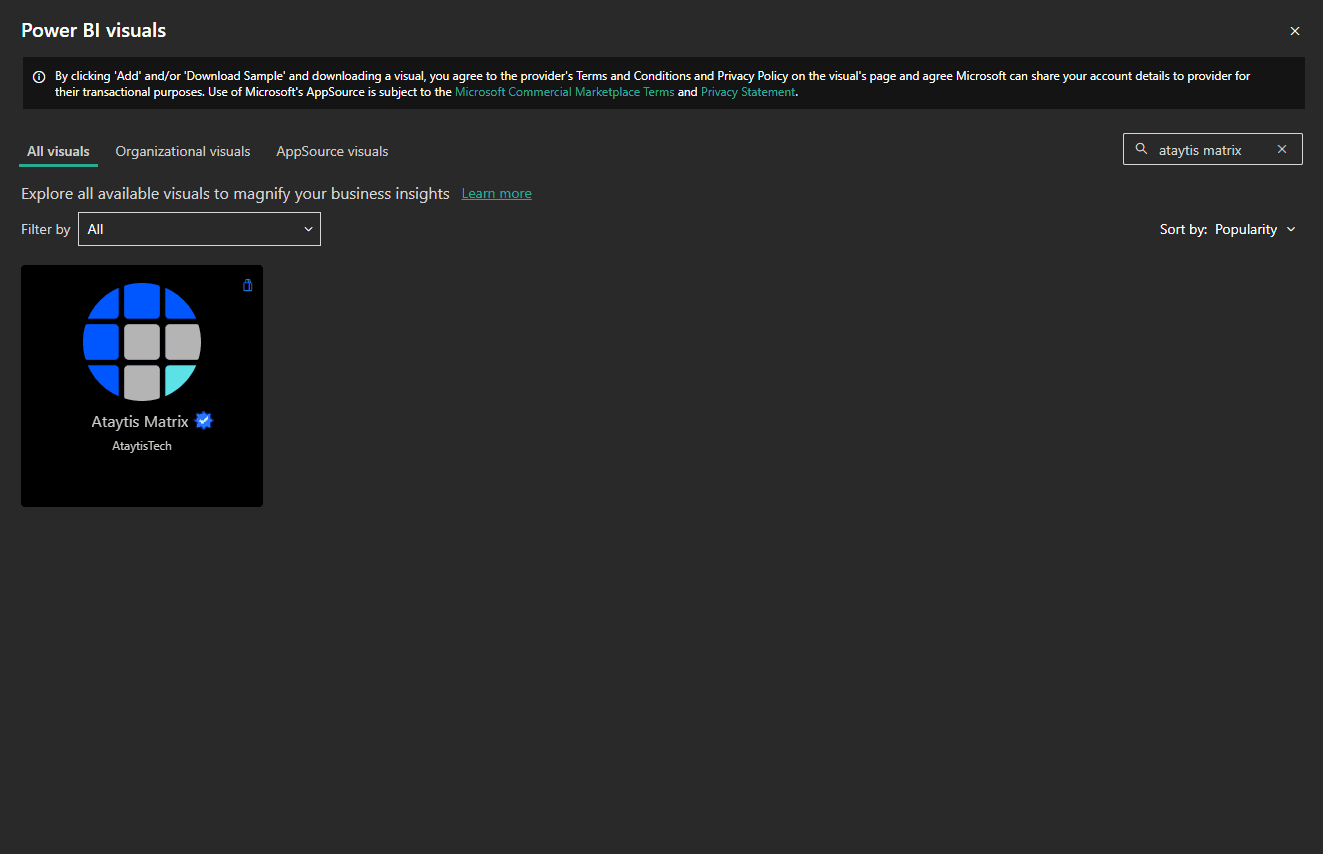
Search for Ataytis Matrix
Enter the full product name and select the listing published by AtaytisTech.
Add the visual
Choose Add. The Ataytis Matrix icon appears in the Visualizations pane.
Save the report
Save the PBIX after adding the visual so the report records its use of it.
Trial and licensing
Ataytis Matrix is a paid visual with a 30-day free trial. Licensing is handled by Microsoft through the Power BI license manager — there is no AtaytisTech checkout, licence key, or activation step, and nothing to manage on this site.
| Situation | What you see |
|---|---|
| Trial active | The full visual, with no watermark. |
| Licensed | The full visual, with no watermark. |
| No licence, Power BI Desktop | The visual renders in test mode with a watermark, so you can still build and evaluate. |
| No licence, Power BI Service | Report viewers are prompted according to Microsoft's standard unlicensed-visual behaviour. |
Microsoft references
Verify the installation
Select the icon
With an editable report page open, choose the Ataytis Matrix icon in the Visualizations pane.
Confirm the wells appear
The Fields pane should list Rows, Columns, Values, Previous Year, Plan, Forecast, Total rows, Format, and Tooltips.
Add a field
Drop any column into Rows. The visual replaces its landing page with a rendered matrix.