Advanced editor
Sparklines
Add compact charts inside cells to show a trend alongside the number.
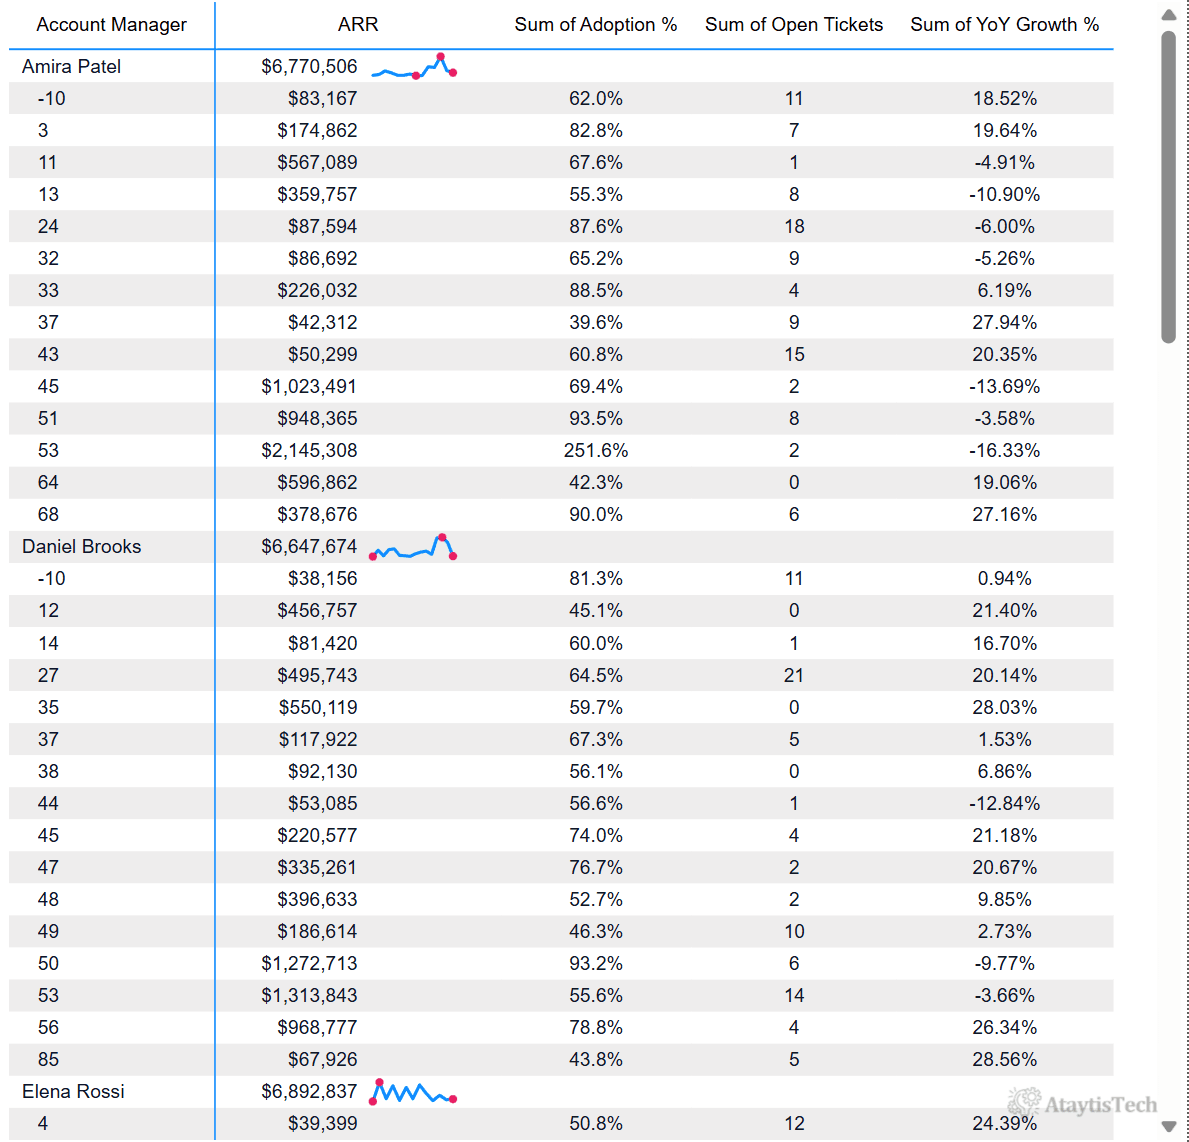
Sparklines in a matrix
A sparkline shows how a value moved to get where it is. In a matrix that answers a question a single number cannot: whether this month's figure is the top of a climb or the bottom of a fall. Sparkline settings live in the advanced editor, reached from the Values card.
| Type | Suits |
|---|---|
| Line | A continuous trend over time — the default choice for a period series. |
| Area | The same trend where the magnitude matters as much as the direction. |
| Bar | Discrete periods compared against each other. |
| Column | The same, drawn vertically. |
| Dot | Individual readings where the path between them is not meaningful. |
| Pin | Values against a baseline, with the stem carrying the distance. |
| Waterfall | Sequential movements building to a result. |
| Win/loss | Direction only, ignoring magnitude — useful for a run of periods that were simply up or down. |