Format pane
Data & Features
Control the rendering mode, the cell load limit, value-column sorting, and Top/Bottom N filtering with its optional toolbar button.
Mode and loading
| Setting | What it does |
|---|---|
| Mode | Either Performance or Features. Performance uses paging and virtualisation, drawing rows as they come into view, which is what keeps a large matrix responsive. Features loads the full result set so that everything depending on complete data — Top/Bottom N in particular — can work. |
| Cells to load | Caps how many cells are fetched and rendered at once. Raising it shows more without scrolling but costs memory and render time. |
| Sort value columns | Allows readers to sort the matrix by clicking a value column header. |
| Sort column grand total | Allows sorting by the column grand total rather than an individual column. |
Top/Bottom N
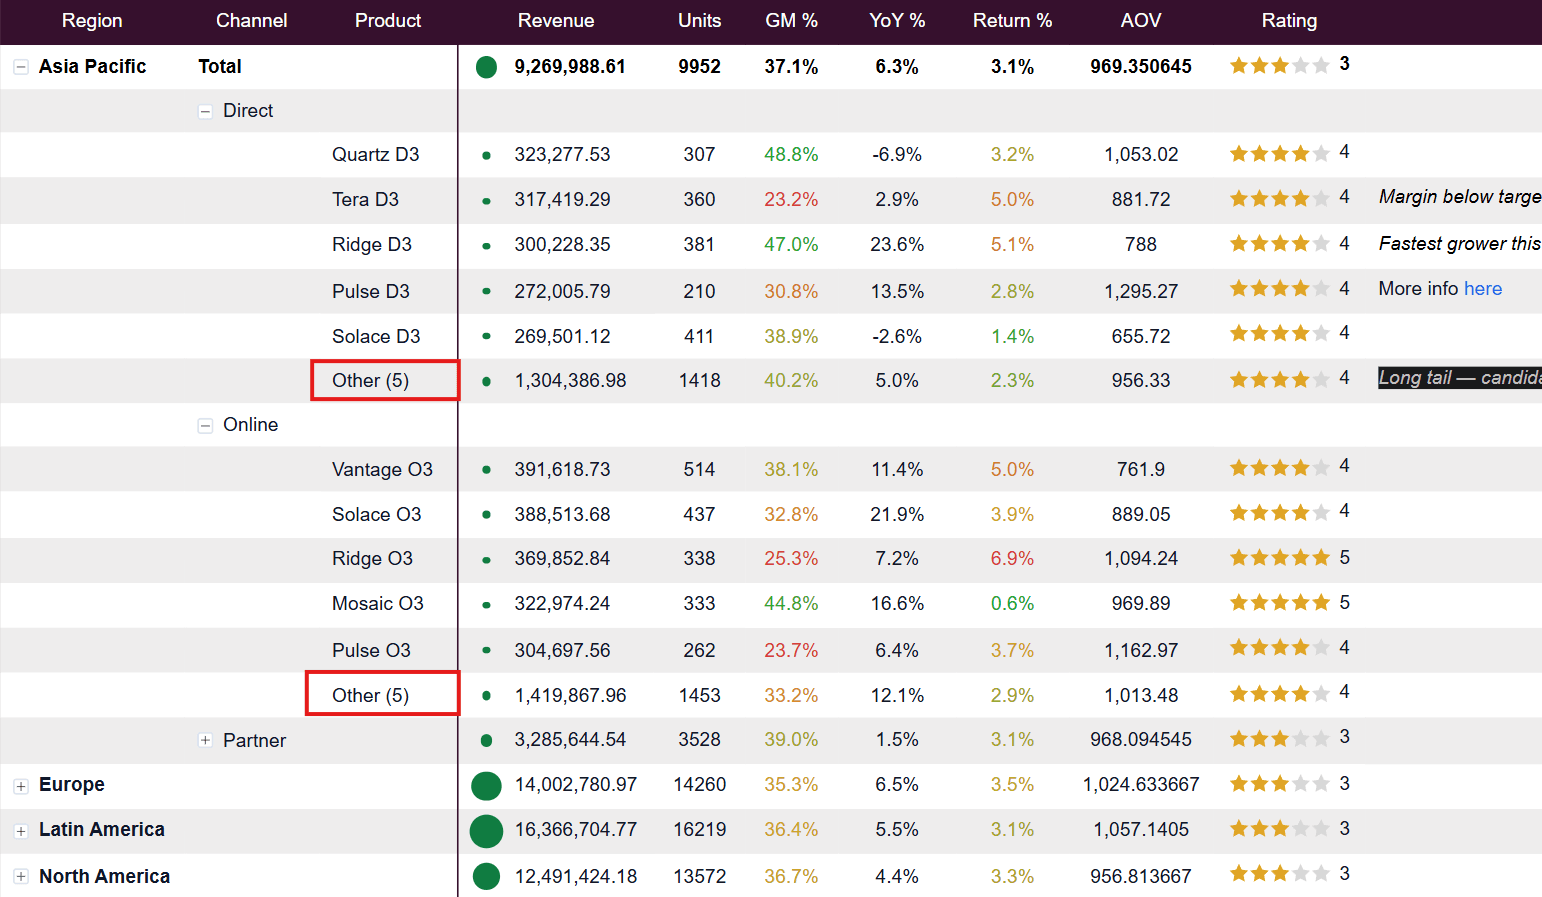
Top/Bottom N reduces the matrix to the highest or lowest ranked members, optionally rolling everything else into a single Other row so the totals still add up.
| Setting | What it does |
|---|---|
| Show | Off, Top, Bottom, or Top & bottom to keep both ends and drop the middle. |
| By | Rank by Value or by Percent. |
| N | How many members to keep. |
| Based on | Which field decides the ranking. |
| Apply to | Which part of the matrix the filter affects — top-level rows. |
| Show remaining as Other | Rolls the excluded members into a single row instead of dropping them. |
| Other title | The label for that row. |
| Show count | Appends the number of members rolled up into Other. |
| Add to toolbar | Gives readers a button to switch the filter on and off themselves. |
When Add to toolbar is on, a second group appears with the button's own text, icon, size, corner radius, font, colours, and border — the same styling controls every toolbar button has.