









Build your first matrix
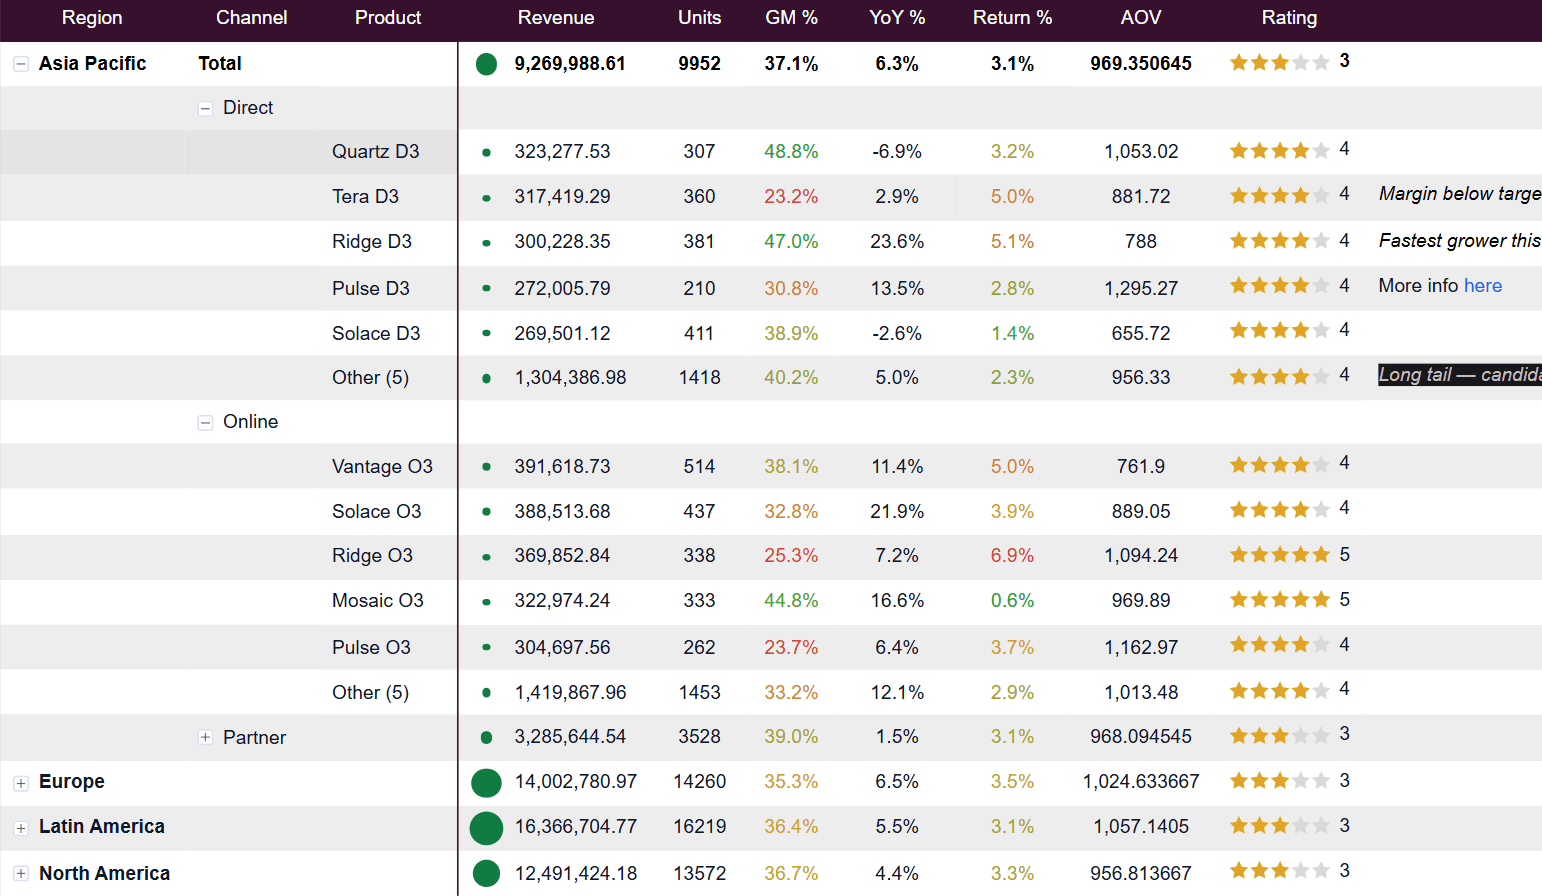
Assign fields, expand a hierarchy, add a comparison column, and set the formatting that makes a table readable.
The first-matrix workflow
Add the visual and size it
Drop Ataytis Matrix onto the page and give it a realistic amount of room. A matrix that is cramped while you configure it will mislead you about spacing.
Assign Rows and Values
Put your grouping column or hierarchy into Rows and a measure into Values. That alone produces a working matrix.
Add Columns if you need them
A date or category hierarchy in Columns turns the matrix two-dimensional. Column hierarchies expand and collapse like row ones.
Set the expansion defaults
On the Hierarchy card, choose whether rows start expanded and to which level. Readers should land on the level that answers their question, not on a wall of detail.
Format the numbers
On the Values card, set decimal places, display units, and how negatives and blanks appear. This is where most of the readability comes from.
Add a comparison
Put a measure into Previous Year, Plan, or Forecast, then open the matching card to choose which variances appear and how they are drawn.
Decide what readers can do
On the Toolbar card, switch on only the tools your audience needs. Everything is off-by-default territory: give them search and export if that helps, leave the rest out.
Common first questions
| Question | Answer |
|---|---|
| Why is the matrix empty? | Nothing is assigned to Rows or Values yet. The visual shows its landing page until at least one field arrives. |
| Why do I not see variance columns? | The Previous Year, Plan, and Forecast cards only take effect when the matching well has a measure in it. |
| Why can readers not use the toolbar? | Every toolbar button is individually switchable on the Toolbar card. They are not shown unless you turn them on. |
| Why is only part of my data showing? | The cell load limit on the Data & Features card caps how much is rendered at once. Raise it, or filter at the report level. |