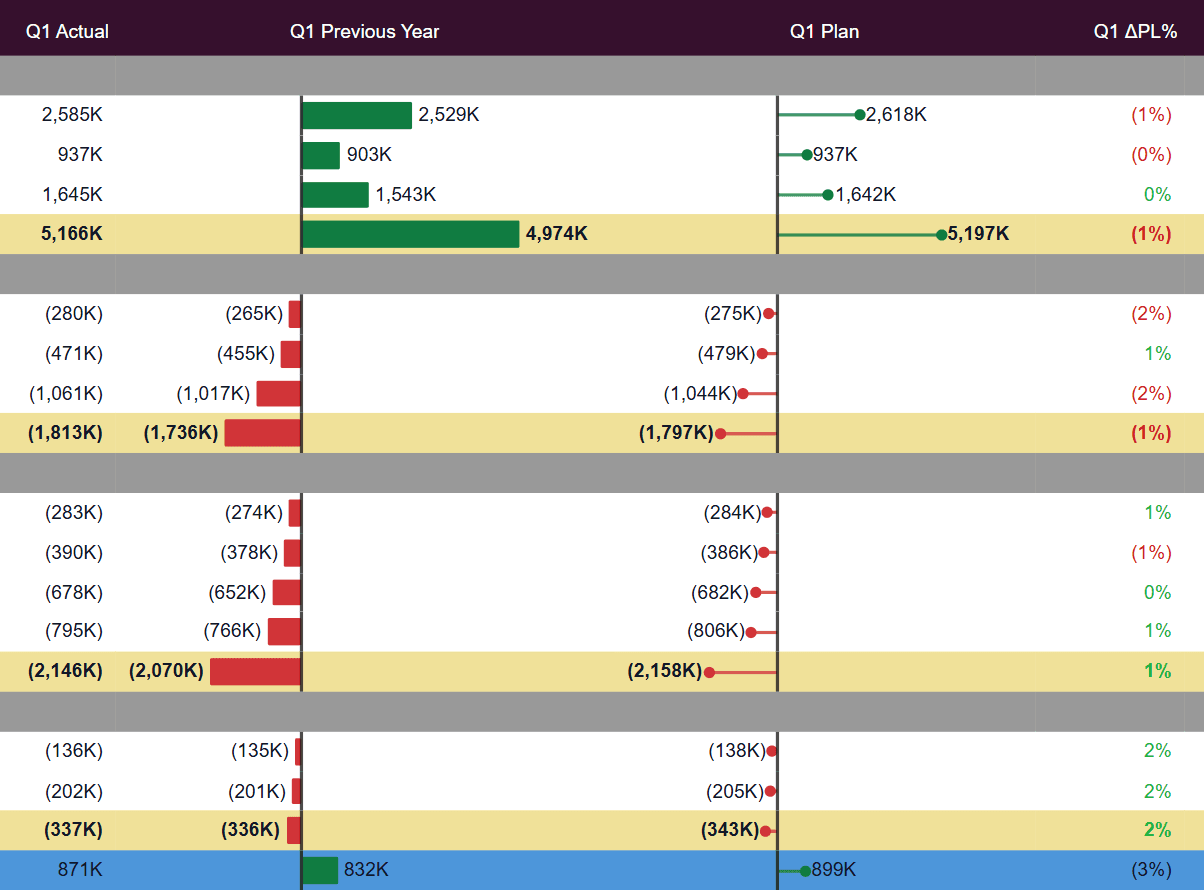
Previous Year, Plan, and Forecast
Turn comparison measures into variance columns, choose how each variance is calculated, and draw the result as a number or a chart.
How the comparison cards work
Previous Year, Plan, and Forecast each have their own card, and all three work the same way. Put a measure in the matching field well, then use the card to say which variances you want and how they should look. The variance itself is derived by the visual — you do not write a separate measure for it, and you do not need a calculation group to switch between comparisons.
| Setting | What it does |
|---|---|
| Show | Whether the comparison column appears. |
| Variance against | What the comparison measures against: Auto, or an explicit choice of Actual, Previous Year, Plan, or Forecast. Auto is the default and picks the sensible counterpart as soon as you drop a measure into the well, so the common case needs no configuration. |
| Variance direction | Which way round the subtraction runs — AC - PY or PY - AC, and the equivalent for Plan and Forecast. This decides whether an improvement reads positive or negative. |
| Variance formula | The expression used, for when neither direction of the default difference is what you need. |
| Edit column | Targets one column so the settings below apply to it alone. |
| Use symbol | Prefixes the variance with Δ, Var, Change, or Difference. |
| Show as, Value, Sticky Value | Whether the variance is drawn as a number or a chart, and how the number behaves alongside it. |
| Positive / Negative / Neutral color | Colours applied by the direction of the variance. |
| Negative below, Positive above | Thresholds for those colours, so small movements can stay neutral. |
| Show chart at level 1 – 6 | Which hierarchy levels draw the variance chart. |
| Chart overrides | Stored per-column chart settings, so different variance columns can be drawn differently. |
Forecast against plan
When more than one comparison measure is present, the Previous Year and Forecast cards expose the cross-comparisons directly — forecast against plan, and previous year against forecast — as both absolute and percentage variances, each with its own formula.
| Setting | Appears on | What it shows |
|---|---|---|
| Show FC - PL / Show FC - PL % | Forecast and Previous Year cards | Forecast against plan, absolute and percentage. |
| Show PY - FC / Show PY - FC % | Previous Year card | Previous year against forecast, absolute and percentage. |
| FC - PL formula, PY - FC formula | Both cards | The expressions behind those variances, if the defaults need changing. |