









Introduction to Ataytis Matrix
Understand what Ataytis Matrix adds over the standard Power BI matrix, how its field wells are organised, and where each group of settings lives.
What is Ataytis Matrix?
Ataytis Matrix is a Microsoft-certified Power BI custom visual for tabular reporting. It renders rows, columns, and values in the way the standard matrix does, then adds the things that reporting work tends to run into: comparison columns, calculated rows you define yourself, formatting that reaches individual rows and columns, a configurable toolbar for report readers, and export that keeps its formatting.
It is a general-purpose matrix. The same visual builds a statutory P&L, a risk register, an operational scorecard, or a headcount breakdown — what changes is the configuration, not the visual.
The field wells
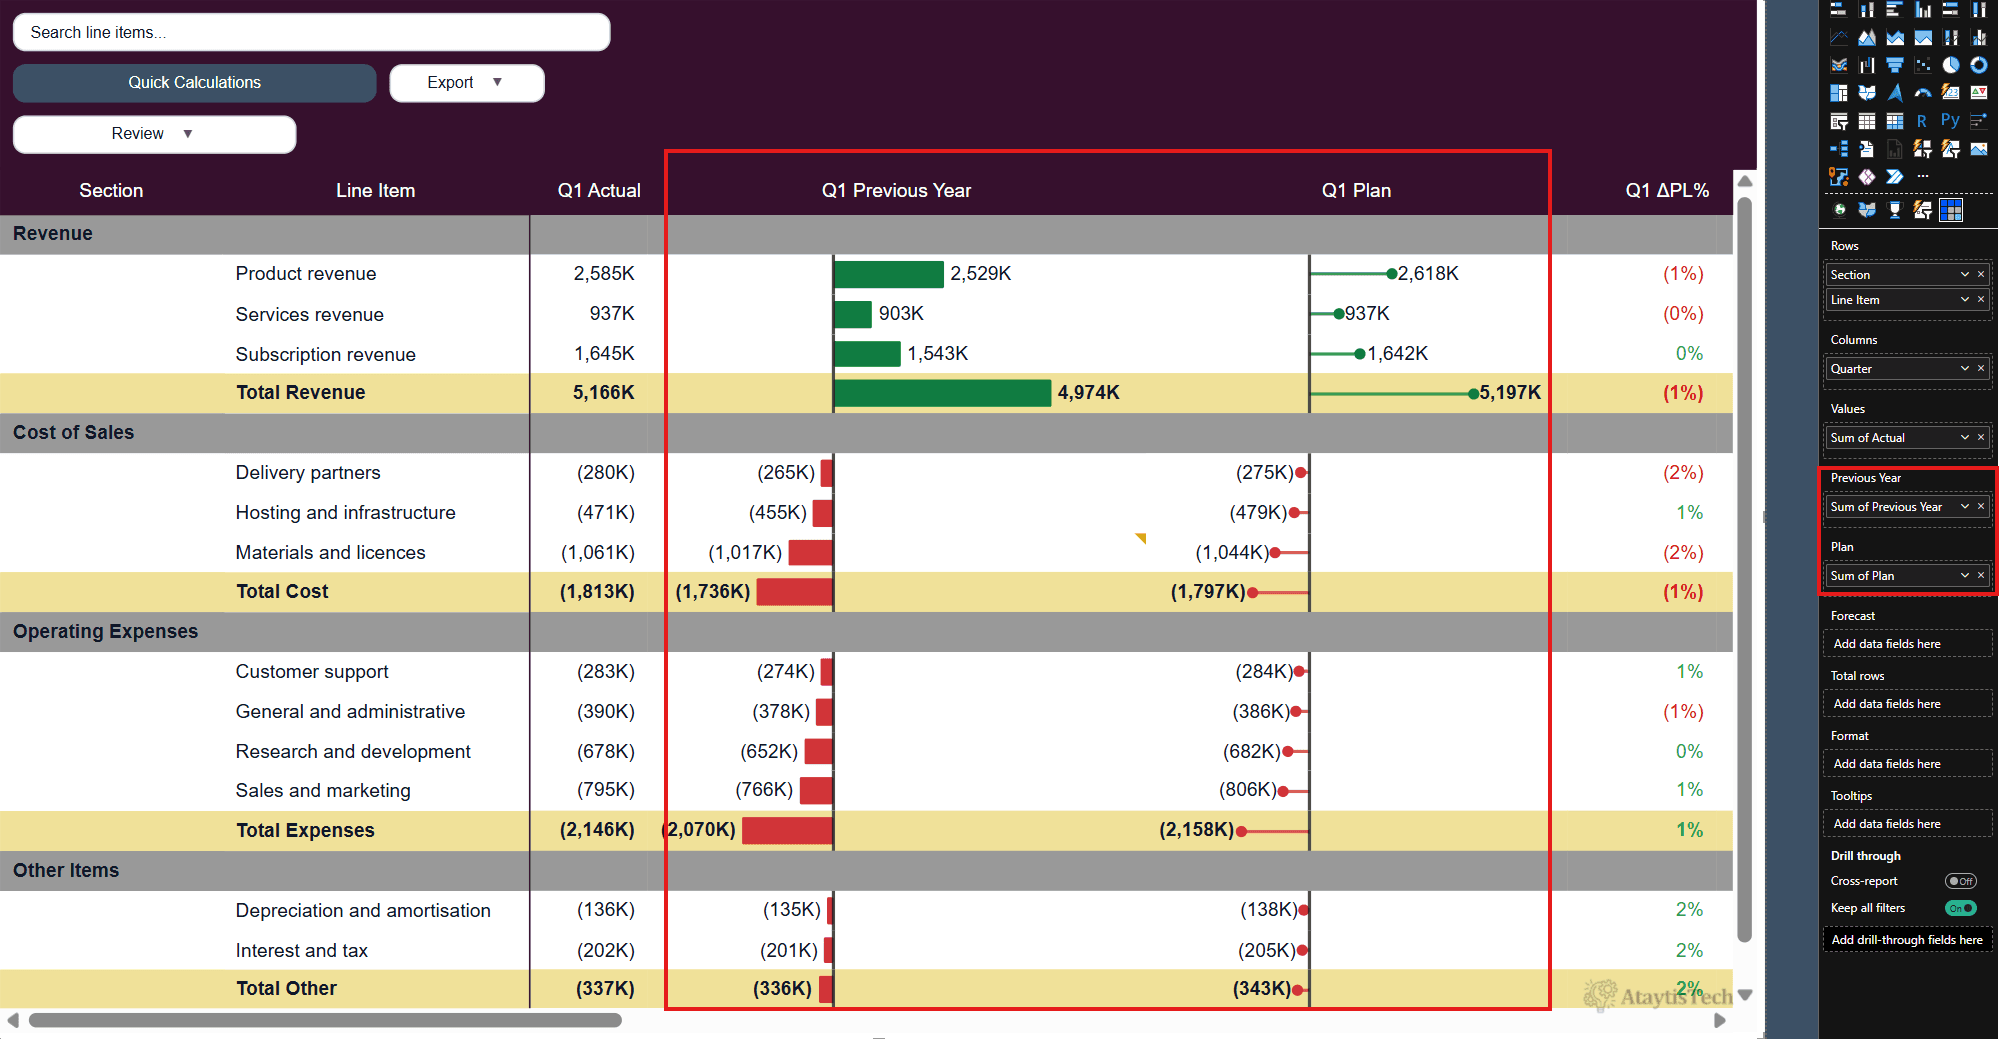
Three wells behave as you would expect from any matrix. The rest are what make the comparison columns possible without writing separate measures for them.
| Well | Accepts | Purpose |
|---|---|---|
| Rows | Columns and hierarchies | The row axis. Supports up to twelve levels of hierarchy with independent styling at each. |
| Columns | Columns and hierarchies | The column axis, expandable and collapsible in the same way as rows. |
| Values | Measures | The numbers in the body of the matrix. |
| Previous Year | Measures | A comparison measure. Supplying it enables the variance columns and in-cell charts on the Previous Year card. |
| Plan | Measures | A second comparison measure, with its own variance behaviour and formatting. |
| Forecast | Measures | A third comparison measure, including the forecast-against-plan variances. |
| Total rows | Measure | A count used to report the true row total when only part of the data is loaded. |
| Format | Measure | A measure supplying a format string, for cases where formatting varies by row. |
| Tooltips | Measures | Extra measures surfaced in the tooltip without adding columns to the matrix. |
Where the settings live
Formatting is organised into twelve cards in the Power BI format pane. Each has a page in this documentation.
| Card | Covers |
|---|---|
| Data & Features | Rendering mode, cell load limit, value-column sorting, and Top/Bottom N filtering. |
| Layout | Row layout, values orientation, and spacer rows between hierarchy levels. |
| Hierarchy | Expansion defaults, indentation, expansion symbols, and per-level styling. |
| Headers | Column and row header text, sizing, sticky behaviour, renaming, ordering, and resize. |
| Values | Number formatting, alignment, colours, alternating rows, in-cell charts, and the advanced editor entry point. |
| Previous Year / Plan / Forecast | One card each: which variances to show, how to calculate them, and how to draw them. |
| Toolbar | Everything the report reader can interact with — search, export, comments, notes, annotation, quick calculations, grouping, and the styling of every button. |
| Totals | Row subtotals, column subtotals, and the grand total row. |
| Grid | Borders and dividers, controlled separately for headers, row headers, and values. |
| Advanced editor | Stored state for conditional rules, sparklines, calculations, column expansion, and header sorting. |
Where to start
If you are new to the visual, work through Get and install, then Build your first matrix. If you are looking for a specific control, the card pages above mirror the format pane exactly, so the fastest route is usually to find the card you are in and read its page.