









Selecting a part
What clicking a part does: selection and cross-filtering, the details panel and each of its sections, tooltips, the row menu and the right-click menu.
What a click does
- Selects the rows behind that position, which filters the other visuals on the page.
- Opens the details panel on the position.
- Ctrl-click adds the position to the selection, or takes it out.
- Clicking the only selected position again clears the selection.
Filtering is turned off with General → Interactions → Filter the report on click, and the details panel with Details panel → Open on click.
The details panel
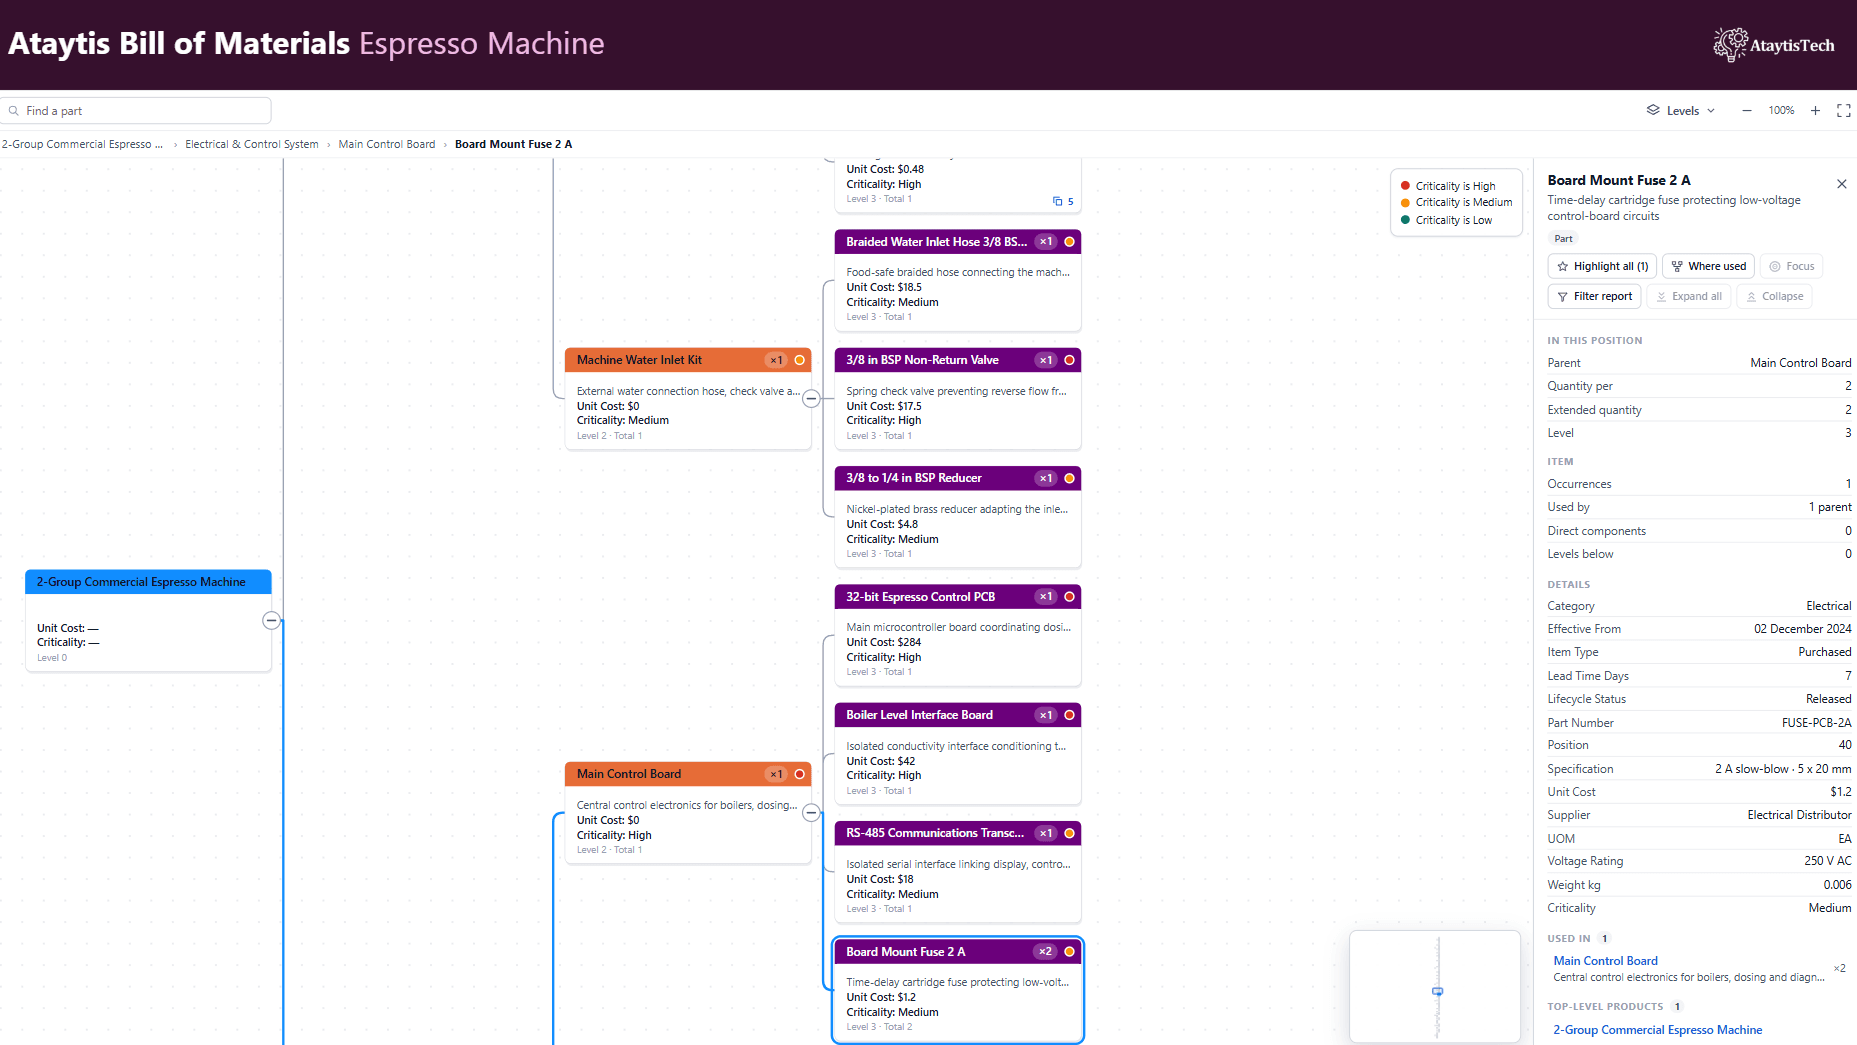
The panel shows everything the visual knows about the selected position. It opens beside the BOM, or over it when the visual is too narrow. At the top are the part number, its description, and chips that say whether it is an Assembly or a Part, Top-level, Shared by a number of parents, or a Circular reference.
| Section | Shows |
|---|---|
| Actions | Highlight all, with the number of occurrences; Where used; Focus; Filter report; Expand all; Collapse. |
| In this position | The parent, the quantity per, the extended quantity and the level. |
| Item | Occurrences, how many parents use it, direct components, levels below and, for an assembly, distinct parts below. |
| Details | Every Details and Tooltips column with a value for this position. Web URL columns are links. |
| Components, Used in, Top-level products | The parts it uses and the parents that use it, with their quantities, and the top-level products it ends up in. Up to 40 of each are listed; select one to go to it. |
Each section can be turned off on the editor's Details panel tab. In where-used, the position section is called In this where-used path, and it shows the component below and the quantities upward.
Tooltips
Hovering a card or row shows a Power BI tooltip with the item, its description, quantity per, extended quantity, level and parent, then how many places it is used when that is more than one, how many components it has, and your Details and Tooltips columns. Up to 24 lines are shown. A report page can be used as the tooltip instead. Tooltips are turned off with General → Interactions → Tooltips.
In the table, the row actions button on each row opens a menu with Show details, Highlight all occurrences, Where used, Focus on this item, Filter report to this branch, Expand all below and Collapse all below. Turn the button off with Table → Hierarchy column → Row actions button.
Right-click
Right-clicking a card or row opens Power BI's own menu for that position, which is where drillthrough appears. Right-clicking empty space opens Power BI's menu for the visual.