









Introduction to Ataytis BOM
What Ataytis BOM draws, the structures it fits beyond manufacturing, the Parent–Child data it needs, the tree and table views, what readers can do, where the settings live, and where to start.
What Ataytis BOM does
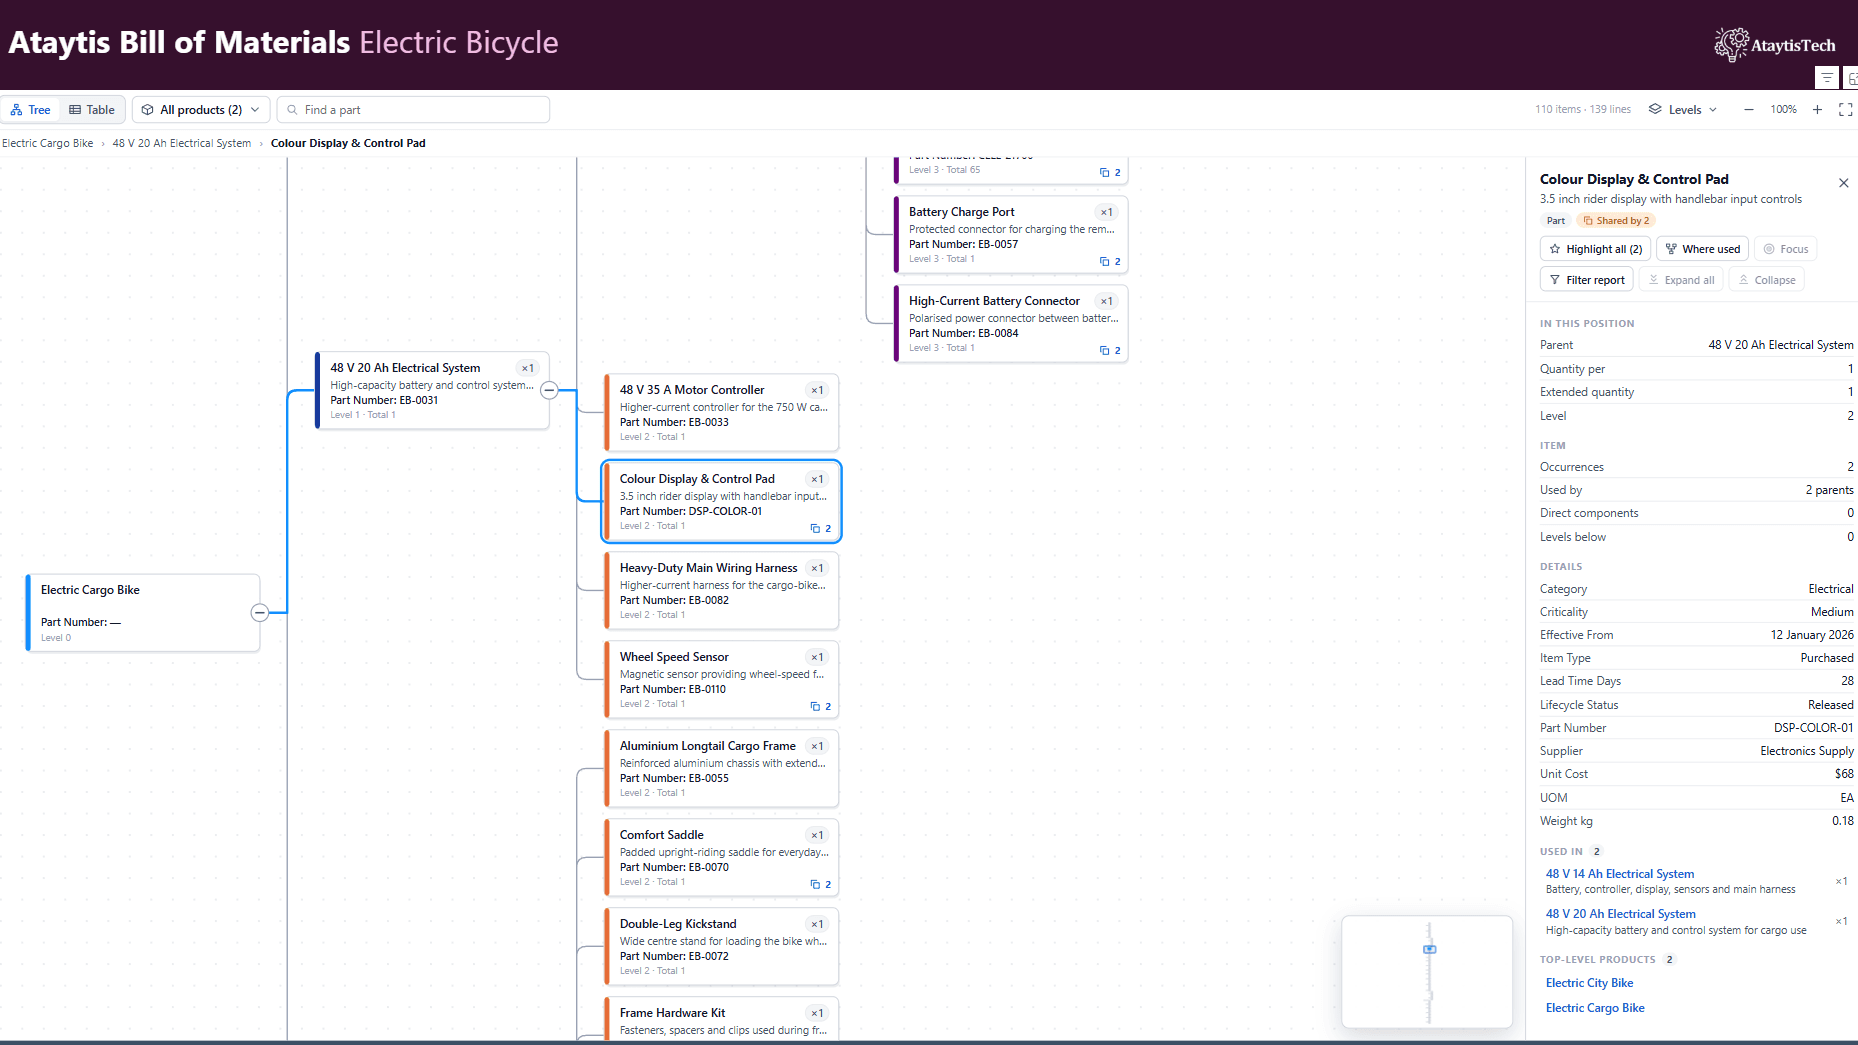
Ataytis BOM is a Microsoft-certified Power BI visual for bills of materials (BOM) and product structure. It builds a multi-level, multi-parent BOM from one row per parent and child, the way most ERP systems export it, and shows it as a hierarchy tree, an indented table, or both.
A part used in several assemblies is one item in several places. You can highlight every occurrence of it, see everywhere it is used, and see its extended quantity along each path from the top-level product.
The data it needs
One row per parent and child. The parent is the assembly or product, the child is the part or sub-assembly it uses, and the quantity is how many of the child one parent needs. There are no level columns to build: the visual works out the levels itself.
| Parent | Child | Quantity |
|---|---|---|
| PUMP-A | MOTOR | 1 |
| PUMP-A | GEARBOX | 1 |
| PUMP-B | MOTOR | 2 |
| MOTOR | BEARING | 2 |
| GEARBOX | BEARING | 4 |
Here BEARING is one part used in three places: in the motor of each pump, and in the gearbox. Preparing BOM data covers the columns in full.
Not only for manufacturing
Anything made of other things has the same shape. The table shows what the parent, the child and the quantity are in each.
| Structure | Parent | Child | Quantity |
|---|---|---|---|
| Product structure | Assembly or product | Part or sub-assembly | Units per assembly |
| Recipe or formulation | Dish, batch or blend | Ingredient or intermediate | Kilograms, litres or units |
| Kit or bundle | Kit or pack | Item packed in it | Units per kit |
| Spare parts | Machine or asset | Module or spare part | Units fitted |
| Software | Application or package | Package it depends on | Left out |
Recipes, kits and other structures works through a recipe, and covers kits, spare parts and software dependencies.
A tree, a table, or both
| Visual | Shows |
|---|---|
| Hierarchy tree | Cards and connectors, from each top-level product down to its parts. |
| Table | An indented BOM grid, with columns for quantities, levels and your own details. |
| Tree + table | Both, with a switch so readers choose. This is the default. |
What readers can do
- Find a part by its part number, its description or any detail column.
- Highlight every occurrence of a part and step through them.
- See where a part is used, all the way up to the top-level products.
- Focus on one assembly, or choose one product from the product picker.
- Filter the rest of the report to everything beneath a position.
- Open a details panel on any position, with its quantities, its details and the parts around it.
Where the settings live
The settings are not in the Power BI format pane. Views, opening, the toolbar, tree and table styling, the details panel, formatting rules and appearance are all set in the advanced editor: select the visual, open More options (…) and choose Edit. The editor previews the BOM from your own data, and the configuration is saved inside the report.
Words used in this manual
| Word | Meaning |
|---|---|
| Item | A part number: a product, an assembly or a part. It is one item however many places it is used. |
| Position | One place in the structure where an item appears: a card in the tree, a row in the table. |
| Relationship | A parent using a child, from one row of your table, or several rows that repeat it. |
| Top-level product | An item at the top of a structure, at level 0. |
| Assembly and part | An item with components, and an item without. |
| Shared part | An item used by two or more parents. |
| Level | How many steps below its top-level product a position is. |
| Quantity per | How many of the child one parent needs, from the Quantity column. |
| Extended quantity | The quantities multiplied along the path from the top-level product. |
| Where used | The BOM read upward from one part, to everything that uses it. |
| Data note | Something the visual found in the table, such as a circular reference, with what it did about it. |
| Field well | One of the five boxes in the Visualizations pane that columns are dropped into: Parent, Child, Quantity, Details and Tooltips. |
Licensing
Ataytis BOM is licensed per user through Microsoft Marketplace. Building and using it in Power BI Desktop needs no licence, and nothing is watermarked. In the Power BI Service, everyone who opens a report containing the visual needs a licence. Get and install the visual has the details.
Where to start
Install the visual
Getting the visual and building with it in Power BI Desktop is free. Get and install the visual covers installing and licensing.
Build a first BOM from fourteen rows
Build your first BOM types a small electric bicycle into Power BI and tries every main feature on it.
Bring in the BOM you already have
From an ERP export, an indented BOM with levels, one file per assembly or a spreadsheet, Bring in your own BOM shows how to turn it into Parent–Child rows.
Set it up for your readers
Choose the views, the columns and the colours in the editor, starting with The advanced editor, and put the visual to work beside the rest of the report with Using it in a report.