









Introduction to Ataytis Vega Studio
Understand what Ataytis Vega Studio is, how it fits inside Power BI, and how its editor, runtime, and Power BI integrations work together.
What is Ataytis Vega Studio?
Ataytis Vega Studio is a Power BI custom visual for authoring and running declarative visualizations with the Vega grammar. It places a JSON editor, a live visual preview, data inspection tools, and diagnostics inside the Power BI report-authoring experience.
Instead of choosing a fixed chart type and being limited to its formatting pane, you describe the visual as a Vega specification. The specification defines the data transformations, scales, axes, marks, labels, signals, and interactions that make up the finished visual. Ataytis Vega Studio connects that specification to the fields placed in the Power BI visual and renders the result on the report canvas.
Who it is designed for
The Studio suits report creators who have hit the limits of the standard visuals: a layout no built-in chart produces, an encoding the formatting pane cannot express, or a design that has to react to the report's own selection and highlight state. Writing Vega is a prerequisite — this is a code-led environment, not a chart picker.
The Ataytis Vega Studio mental model
Power BI supplies the data
Columns and measures placed in the visual's Values field well are converted into the main Vega dataset named
dataset.The Vega specification describes the visual
Your JSON references the
dataset, applies any required transforms, and defines the marks, scales, axes, legends, signals, and events.The Studio validates and previews changes
Apply changes manually or enable live preview. The current specification is parsed and the preview is updated inside the editor.
The inspector explains what is happening
Inspect available datasets, view live signal values, and read Vega warnings or errors without leaving the authoring environment.
Power BI hosts the finished visual
The saved specification renders on the report canvas and can participate in supported Power BI tooltip, selection, highlighting, and context-menu workflows.
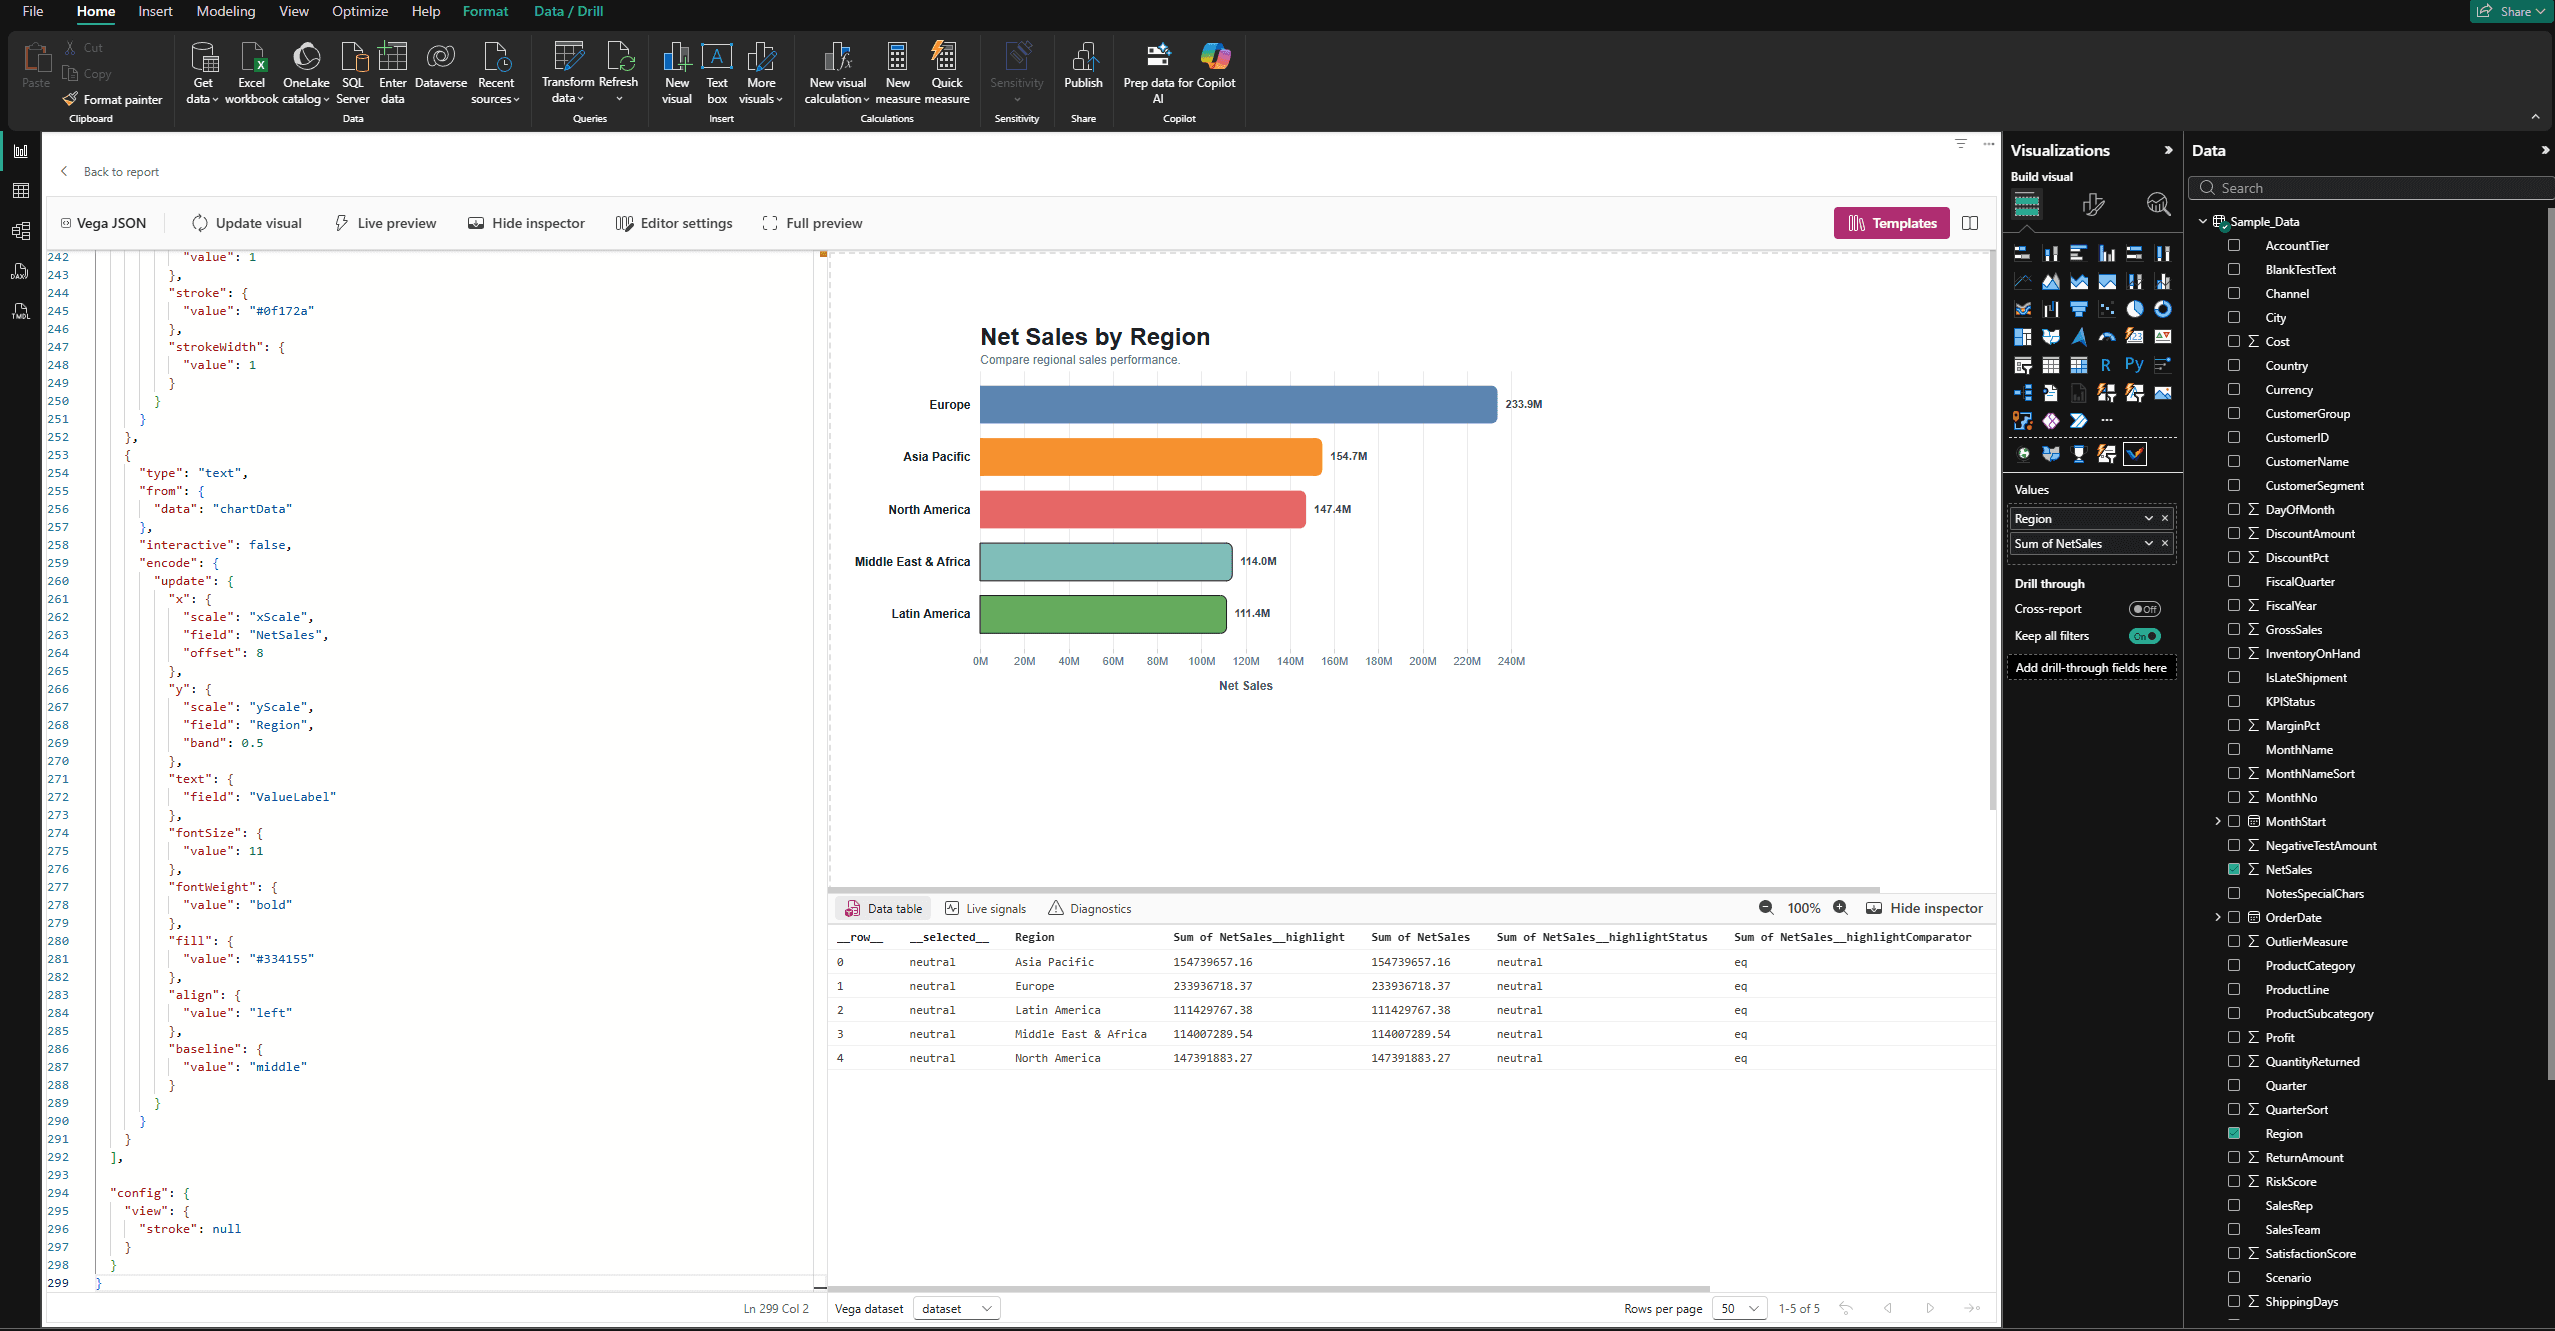
Core capabilities
| Capability | What it provides |
|---|---|
| Vega JSON authoring | A Monaco-based editor for the Vega specification, with JSON validation as you type. |
| Manual or live preview | Use Ctrl+Enter to apply deliberately, or toggle live preview with Ctrl+Shift+Enter. |
| SVG and Canvas output | Choose scalable SVG output or Canvas rendering for denser mark counts. |
| Data inspection | Review the Power BI-backed dataset and any other datasets created by the specification. |
| Signal inspection | See the current value of the signals present in the running Vega view. |
| Diagnostics | Review parsing errors, Vega warnings, and messages at a selectable log level. |
| Power BI extensions to Vega | Theme-aware colour schemes, Power BI number formatting, pattern fills, and cross-filter expressions available inside the specification. |
| Ready-made specifications | Paste a Vega specification from the AtaytisTech Library, or reuse one of your own, and assign your fields to it. |
| Power BI integration | Power BI tooltips, context menus, cross-filter selections, and cross-highlight-aware data fields. |
Product architecture
- A specification describes a visual and the fields it expects; it does not package or transfer the underlying Power BI data.
- The editor opens on an empty specification. Ready-made specifications are distributed through the AtaytisTech Library and applied by pasting their JSON into the editor.
- The visual receives a window of up to 10,000 categorical rows from Power BI. Model design, filtering, and aggregation still matter for performance and correctness.
- Some host capabilities can be controlled by Power BI administrators, including access to AppSource visuals and downloading files from custom visuals.