









Authoring fundamentals
The Studio workspace
Learn the purpose of every major area in the Ataytis Vega Studio editor and configure the workspace for efficient authoring.
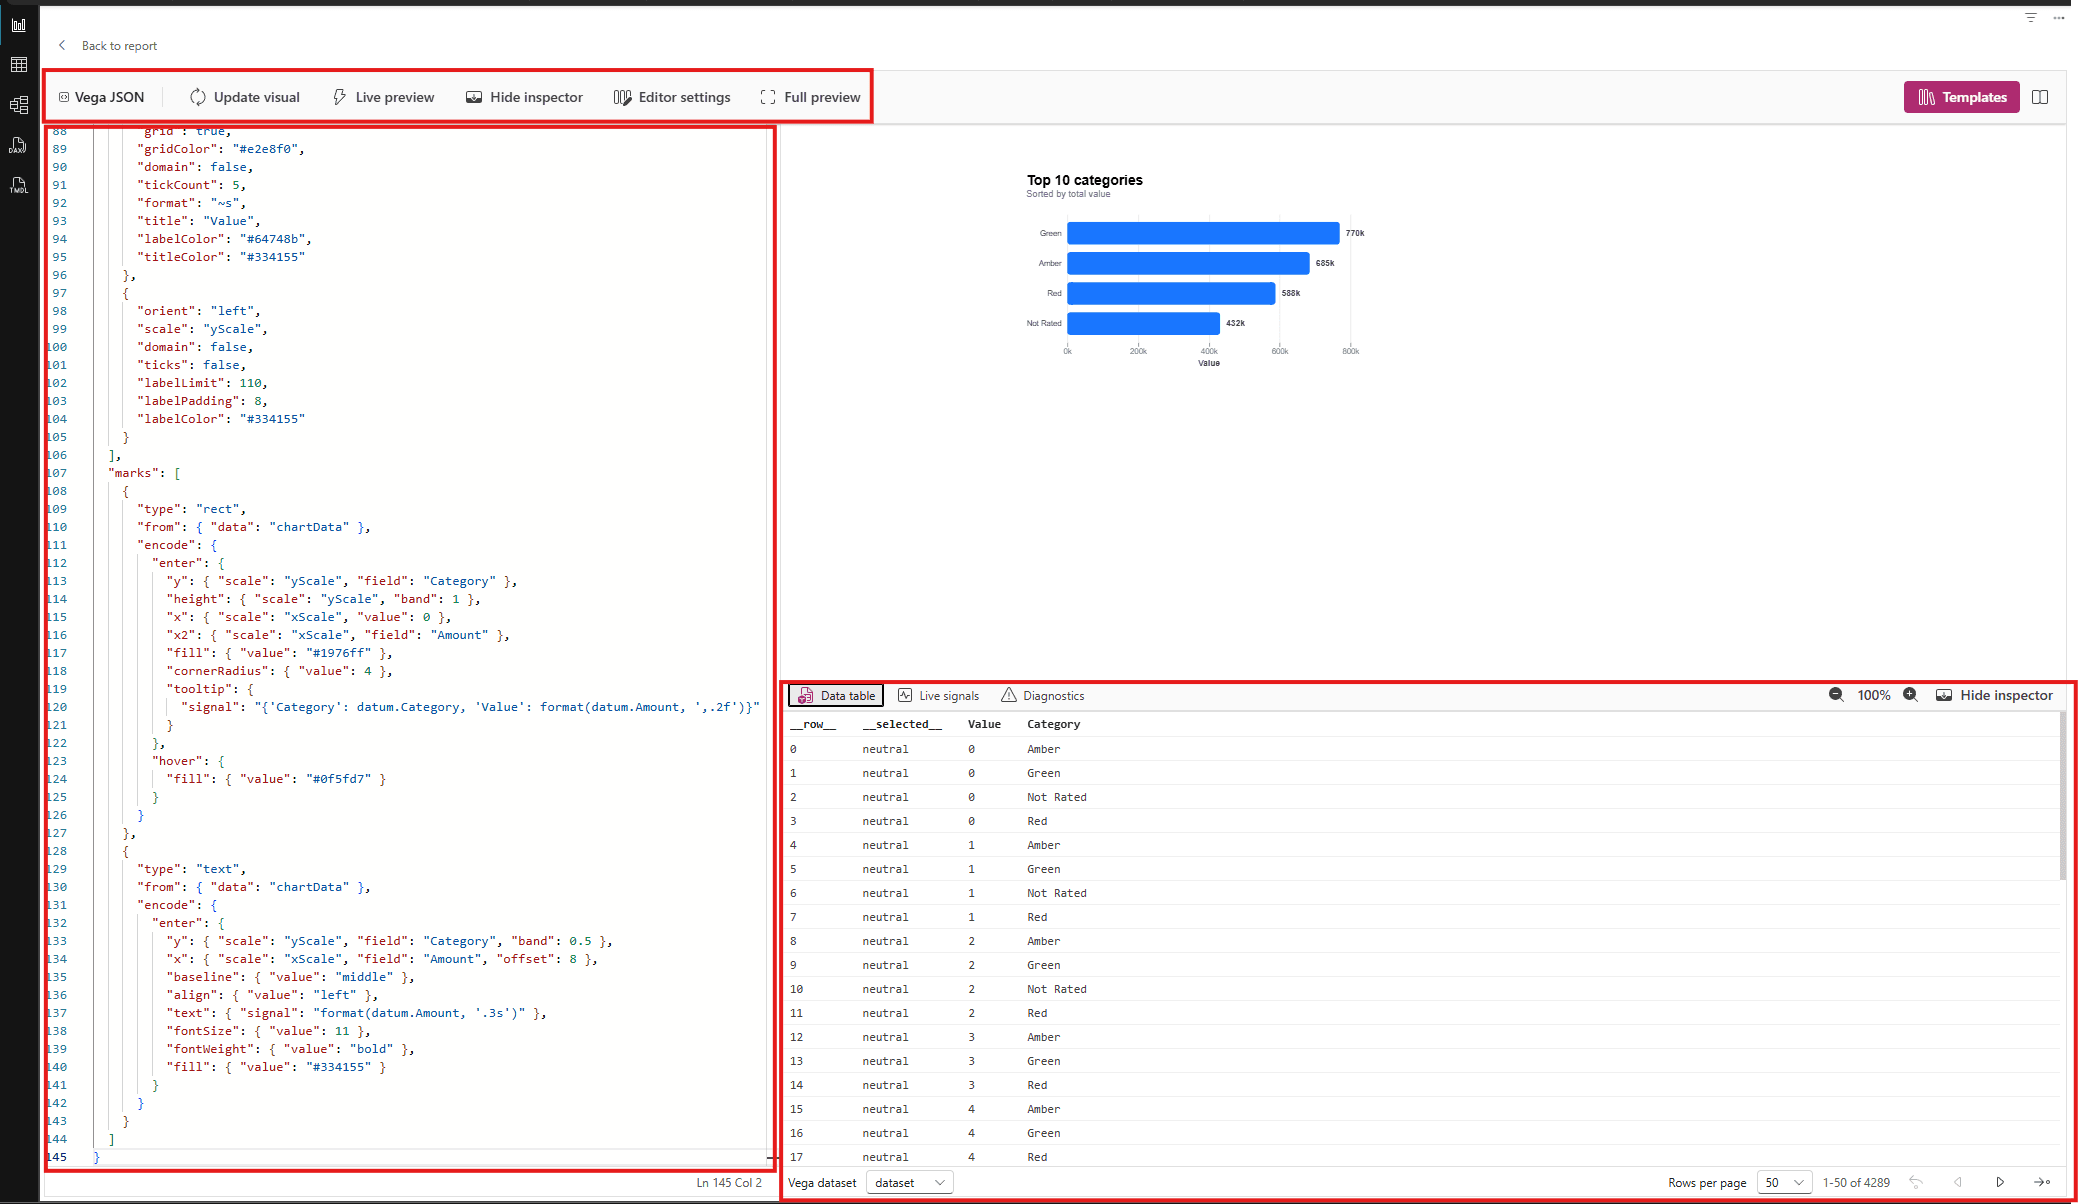
Workspace map
| Area | Purpose |
|---|---|
| Command bar | Apply changes, toggle live preview, open or close the inspector, change editor settings, enter full preview, open the AtaytisTech Library in a browser, and open help. |
| Vega JSON editor | Author the specification: data references, transforms, scales, marks, signals, and event definitions. |
| Preview | Render the current applied specification using the selected SVG or Canvas renderer. |
| Inspector | Switch between Data table, Live signals, and Diagnostics while keeping the editor open. |
| Status bar | Shows the cursor line and column, the length of any selection, and the field-tracking indicator. |
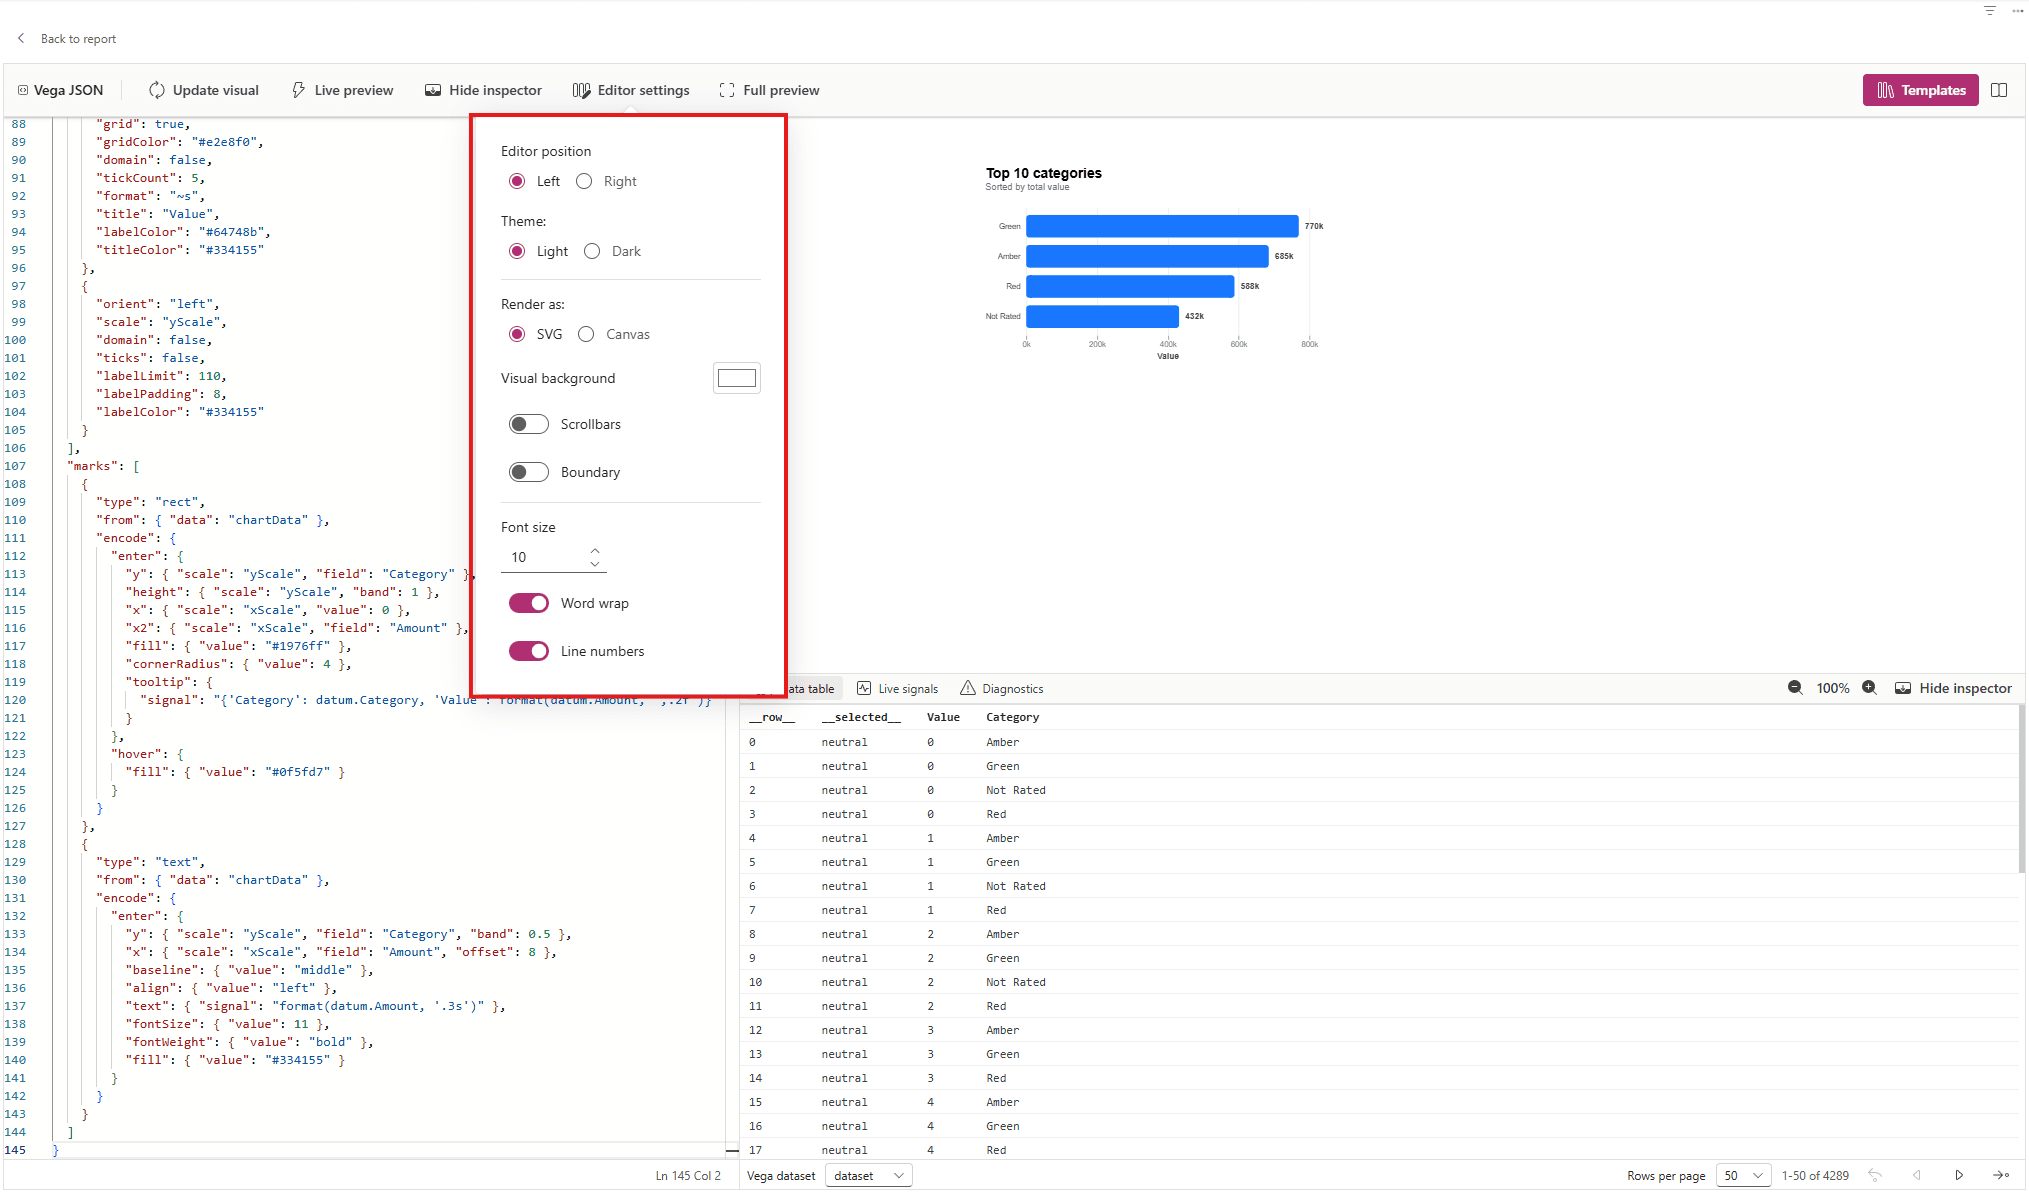
Editor settings
| Setting | Options and effect |
|---|---|
| Editor position | Place the JSON editor on the left or right of the preview. |
| Theme | Use the light or dark Studio interface. |
| Render as | Choose SVG or Canvas for the applied Vega view. |
| Visual background | Set the background shown behind the previewed visual. |
| Preview scrollbars | Show scrollbars when content exceeds the available preview area. |
| Preview boundary | Show the Power BI viewport boundary while authoring. |
| Font size | Adjust editor text from 8 to 30. |
| Word wrap | Wrap long JSON lines instead of requiring horizontal scrolling. |
| Line numbers | Show or hide line numbers in the code editor. |
Working efficiently
- Use manual update while restructuring JSON so incomplete edits do not repeatedly re-render.
- Switch to live preview when refining small, valid changes and immediate visual feedback is useful.
- Collapse the editor or inspector when you need more room to assess the preview.
- Use Full preview to evaluate the visual without editor panes; press
Escto return. - Keep Diagnostics visible during complex transform or signal work so errors are noticed immediately.
- Use the preview boundary when designing responsive layouts against the actual Power BI viewport.