









Inspector and diagnostics
Use Data table, Live signals, and Diagnostics to understand the running Vega view and resolve problems methodically.
Open the inspector
Choose Inspect visual from the command bar or press Ctrl + backquote to open and close the inspector. The inspector remains connected to the current applied Vega view and updates as the visual renders.
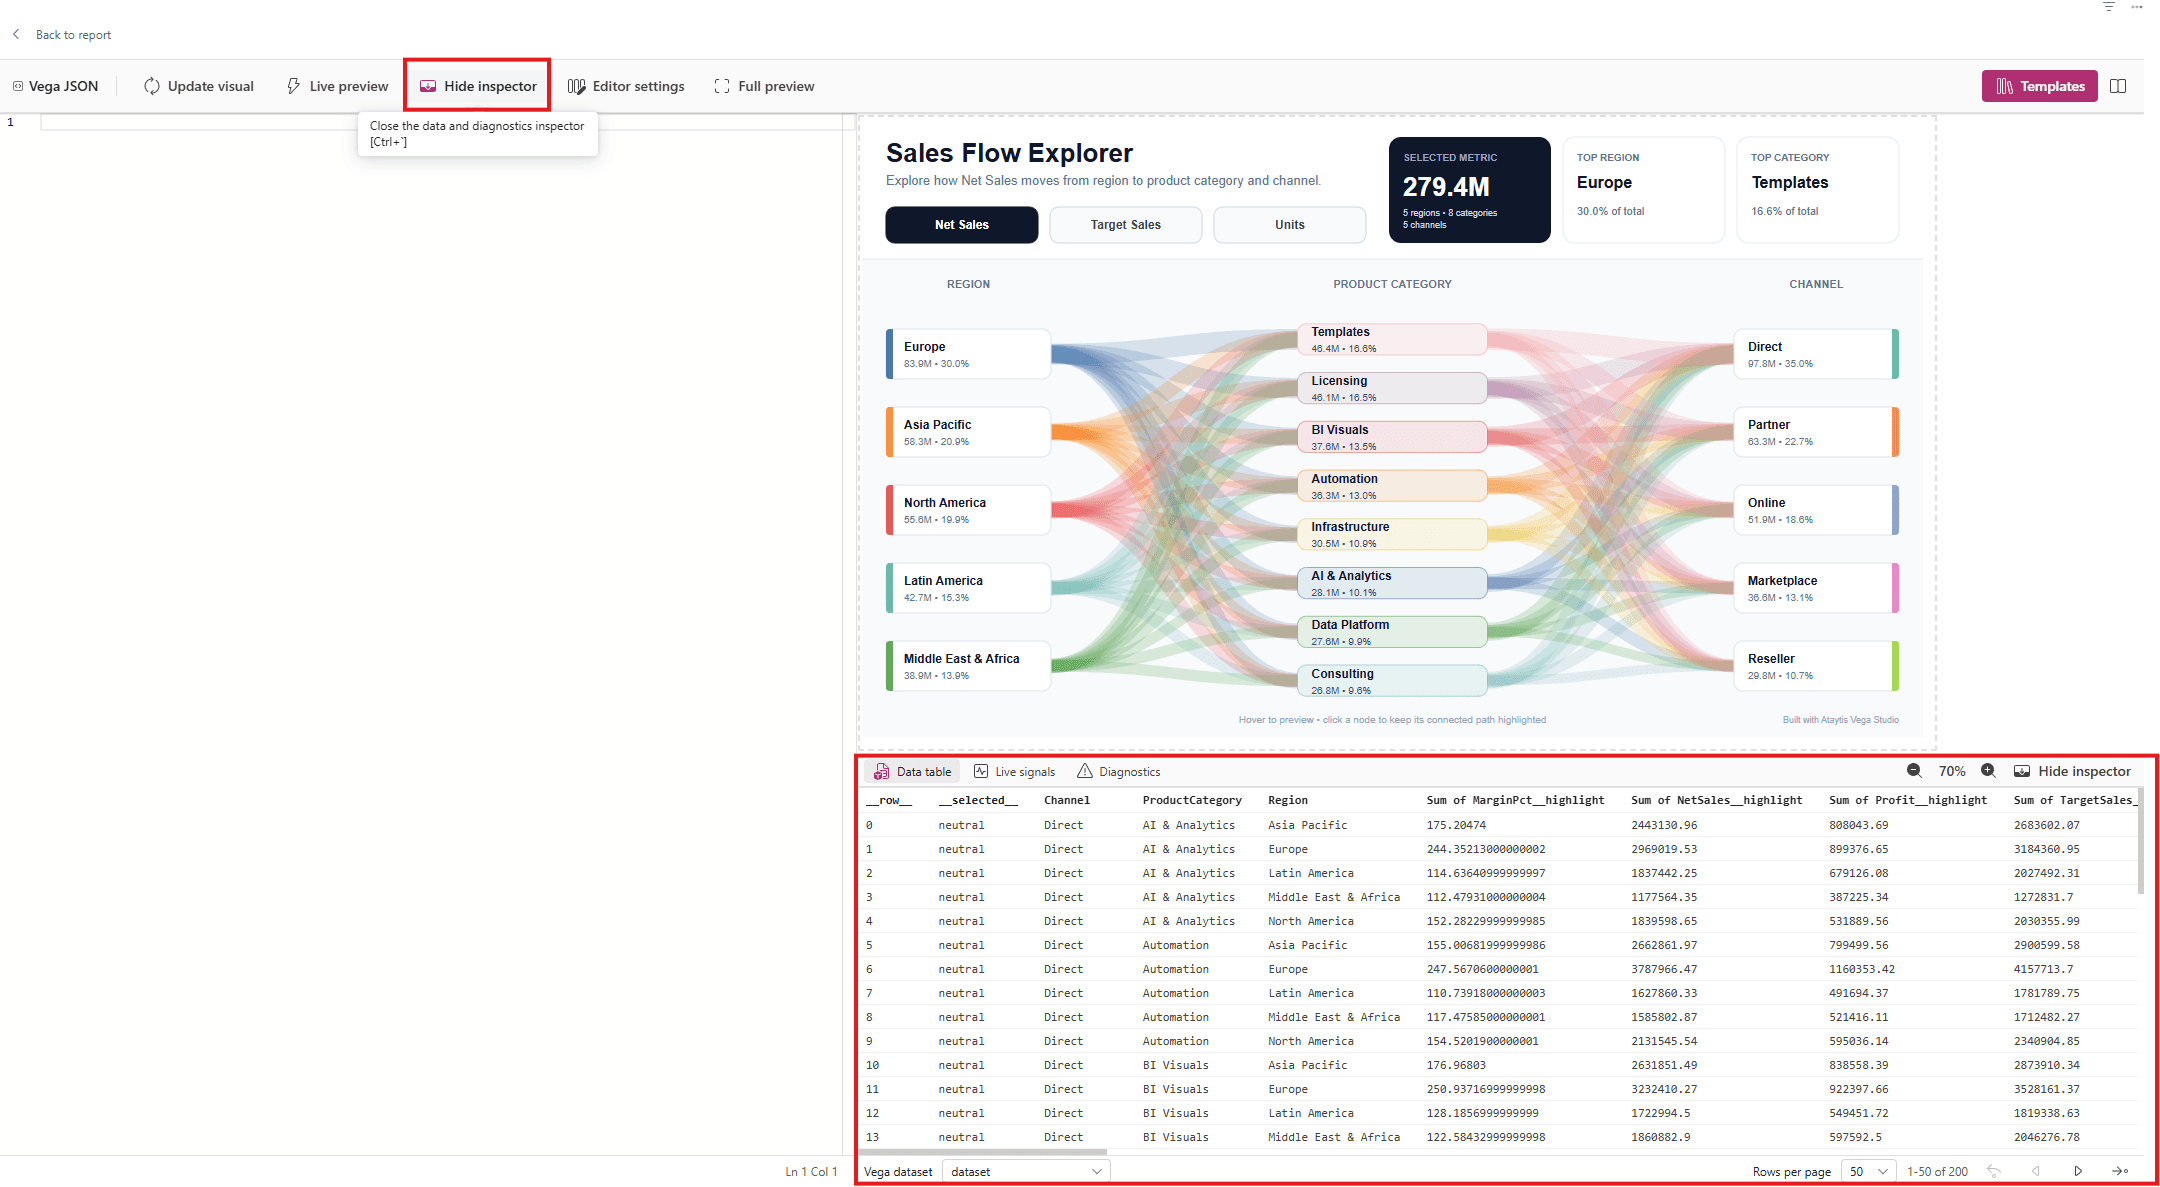
Data table
Data table shows any one dataset from the Vega view — the Power BI-backed dataset or anything your transforms derive from it. It is where you confirm that a field is named what you think it is named, and that a transform produced the records you expected. Rows can be sorted and paged at 10, 25, 50, 100, 150, or 200 per page, with the header fixed while you scroll.
- Start with
datasetto validate the Power BI input. - Use the Vega dataset selector at the foot of the table to switch to a derived dataset and inspect your transforms step by step.
- Look for
NaN, circular, infinite, object, or truncated-value placeholders that point to unexpected data shapes. - Compare field names here with every
fieldanddatum[...]reference in the specification.
Live signals
Live signals lists every signal in the running Vega view alongside its current value. Because the values update as you interact with the preview, it is the fastest way to find out why an event handler, brush, or responsive calculation is not behaving as you expect.
Diagnostics
Diagnostics presents specification and configuration parsing errors plus Vega warnings at the selected log level. If no warnings or errors are present, the inspector reports that no log messages require attention.
| Log level | Use |
|---|---|
| None | Suppress diagnostic messages. |
| Error | Show failures that prevent correct parsing or rendering. |
| Warn | Include Vega warnings that may indicate invalid assumptions or deprecated behavior. |
| Info | Include normal informational status; this is the default project level. |
| Debug | Expose the most detailed available diagnostic output when deeper investigation is required. |
Debugging sequence
Open Diagnostics
Resolve JSON parsing errors before investigating data or styling.
Inspect dataset
Confirm the expected rows and fields reach the Vega view.
Inspect derived datasets
Find the first transform whose output differs from your expectation.
Inspect signals
Confirm parameters and event-driven state have the expected live values.
Reduce the specification
Temporarily remove later marks or transforms until the smallest failing section remains.
Reapply and retest
Apply one correction at a time, then validate both the Studio preview and Power BI report canvas.