











Ataytis Vega Studio
Build the visual your report actually needs. Flows, radials, animated projections — charts Power BI does not ship, drawn from your own data and styled to your report.
Free on Microsoft Marketplace, installed straight into Power BI Desktop.
Sample report
See it running
Every visual in this report was built with Ataytis Vega Studio. It is a working Power BI report, embedded here — have a click around it.
Charts that move
Motion earns its place when it carries meaning. A projection that builds as it runs forward lands the shape of the trend before anyone reads a single number — the kind of thing a static chart cannot do, and the standard visuals will not give you.
Paste. Render. Done.
A specification goes in, and a working visual comes out — one you would have no way of building with the standard chart types. That is the whole point: the shape of the visual is a decision you get to make, rather than one the tool makes for you.
You are never designing blind
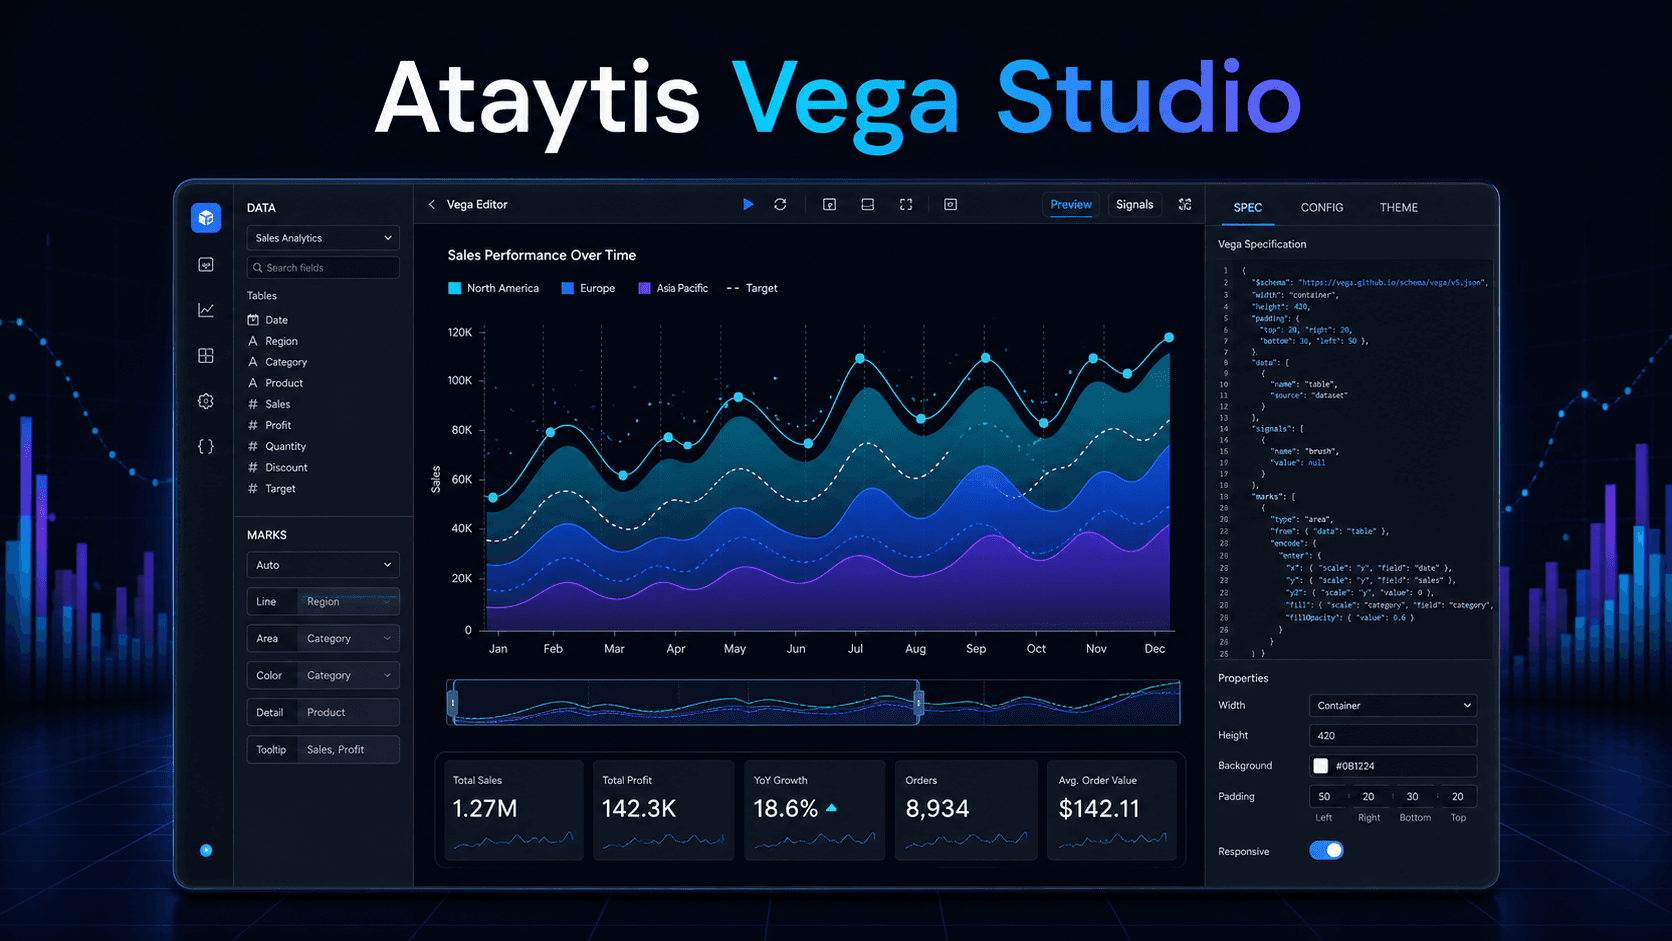
The visual is defined on the left and drawn on the right, against your real data, as you work. What you see in the editor is what lands on the report page.
Why it is different
Built to sit in a real report
Not a widget bolted onto the page — a visual that reads your data, follows your styling, and answers to your filters.
Chart types Power BI does not ship
Flows, radials, networks, and layouts you would otherwise have to fake with images or give up on.
It matches your report
Colours follow your report theme and numbers follow the formatting already set on your measures, so it never looks bolted on.
It filters like a native visual
Click a mark and the rest of the page responds. Cross-highlighting from other visuals flows back in.
Any size, any screen
Visuals reflow to the space they are given, from a small tile to a full-page canvas.
Accessible by design
Patterns alongside colour, and readable output for screen readers and greyscale printing.
Ready-made or from scratch
Start from a Library specification and change what you need, or build your own from an empty canvas.
The full technical detail lives in the documentation.
Getting started
From install to published report
Install once, then it is there every time you build a report.
Install from Marketplace
In Power BI Desktop, open Get more visuals, search for Ataytis Vega Studio, and add it. Once per machine.
Assign your fields
Drop the columns and measures the chart needs into the Values well. Their display names become the field names in Vega.
Write or paste a spec
Open the editor from the visual's Edit action. Write the specification, or paste one from the AtaytisTech Library.
Apply and publish
Ctrl+Enter applies the specification. From there it saves with the PBIX and publishes like any other visual.
AtaytisTech Library
You do not have to start from an empty editor
The Library publishes finished Vega specifications built for this visual — flow diagrams, radial charts, and layouts that no standard Power BI visual produces. Each one lists the fields it expects, so you copy the JSON, assign your own columns and measures, and you have the chart.
Questions
Frequently asked questions
Free, certified, and installed in about a minute
Add it from Microsoft Marketplace and your next report can look like nothing else in the business.