









Create your first visual
Build a first Vega specification with Power BI data, preview the result, and save it back to the report.
The first-visual workflow
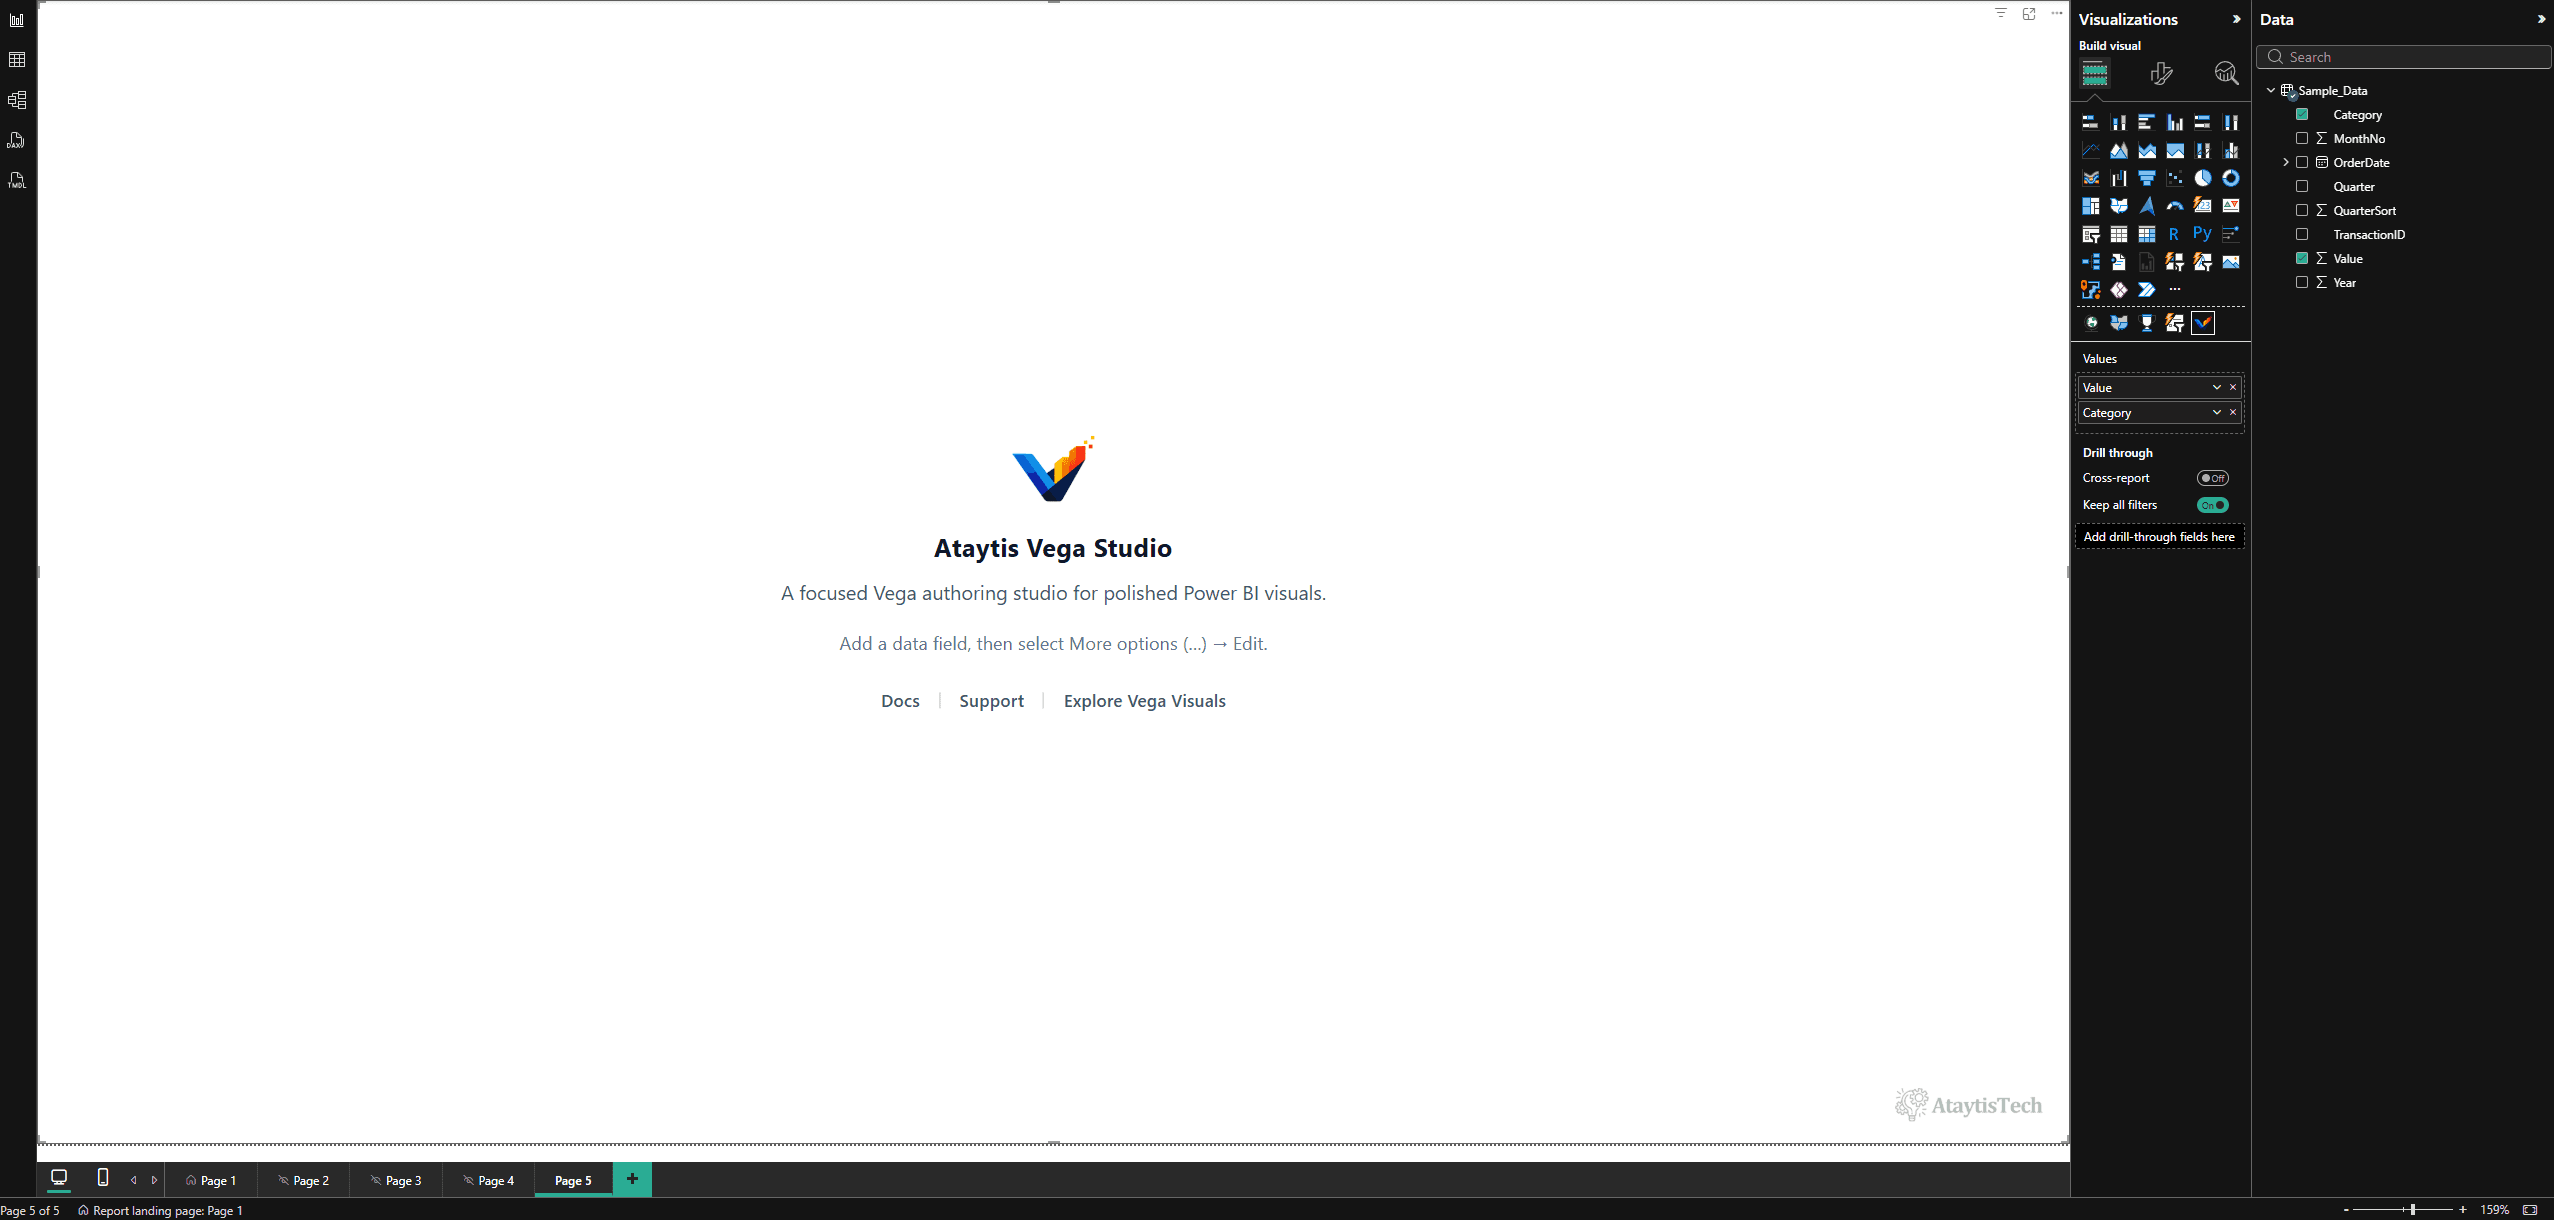
Add Ataytis Vega Studio to the page
Select the visual icon and resize the new visual container to a practical authoring size.
Assign fields to Values
Add the columns and measures needed by the visual. Their Power BI display names become field names available in the Vega
dataset.Open the Studio editor
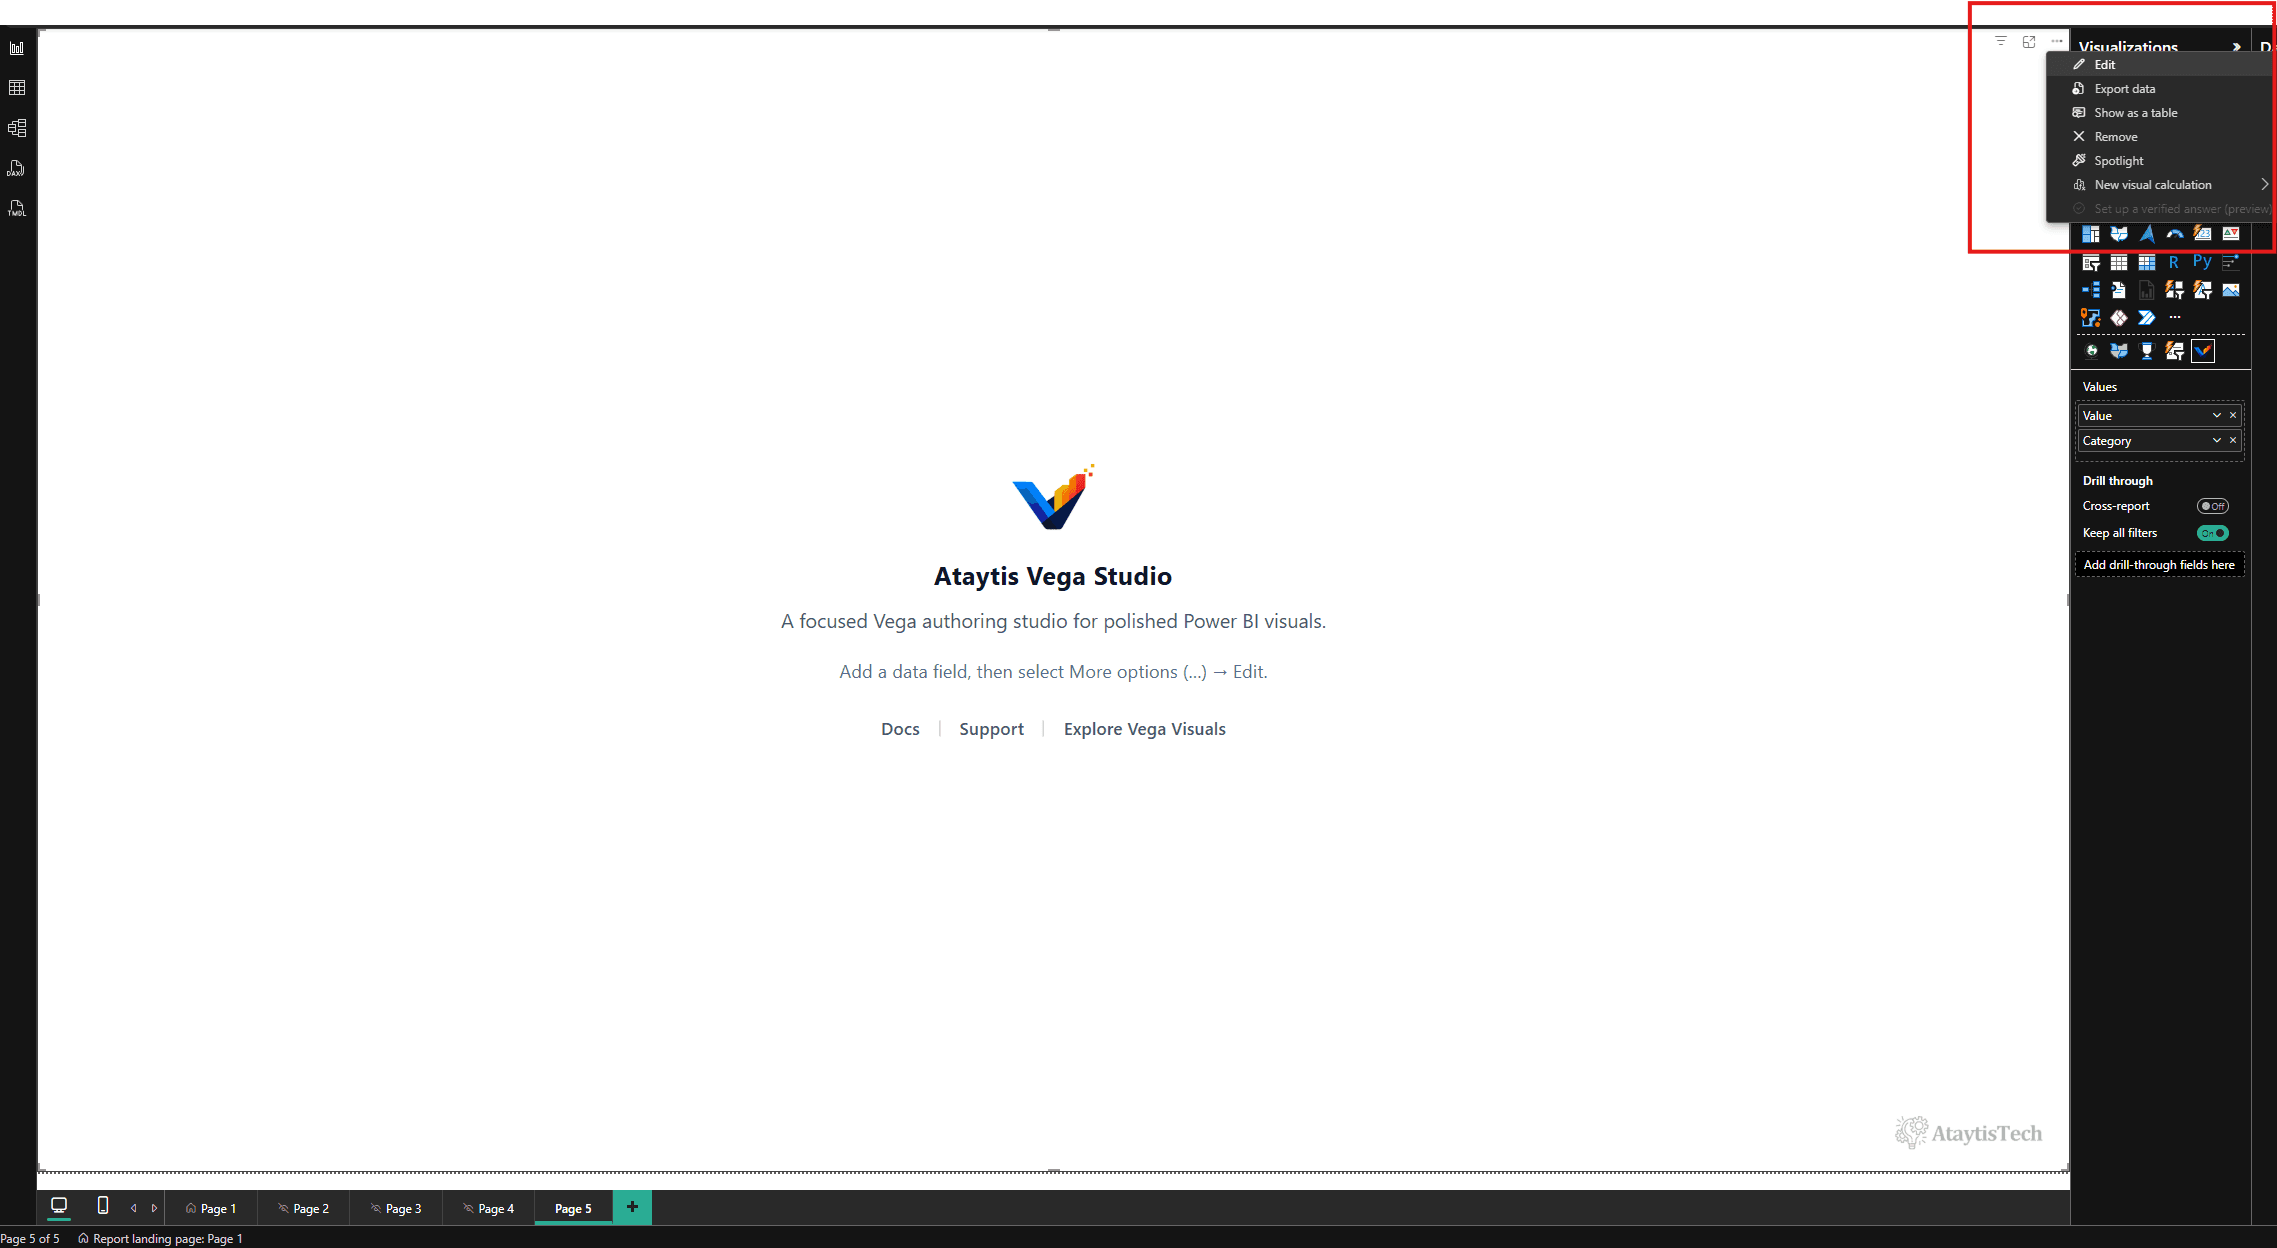
Select the visual and open its Edit or advanced-edit experience from the visual header.
Start from the empty specification
The Spec editor opens on an empty JSON object. Everything the visual renders comes from the specification you write or paste there.
Write or paste the specification
Define transforms, scales, axes, and marks that reference the fields in
dataset. Keep field-name capitalization and punctuation exact.Apply and inspect
Press
Ctrl+Enteror choose Update visual. If the result is blank or invalid, open Diagnostics and Data table before changing the code again.Return to the report and save
Exit the editor when the preview is correct, test the visual on the report canvas, and save the PBIX.
A practical first specification
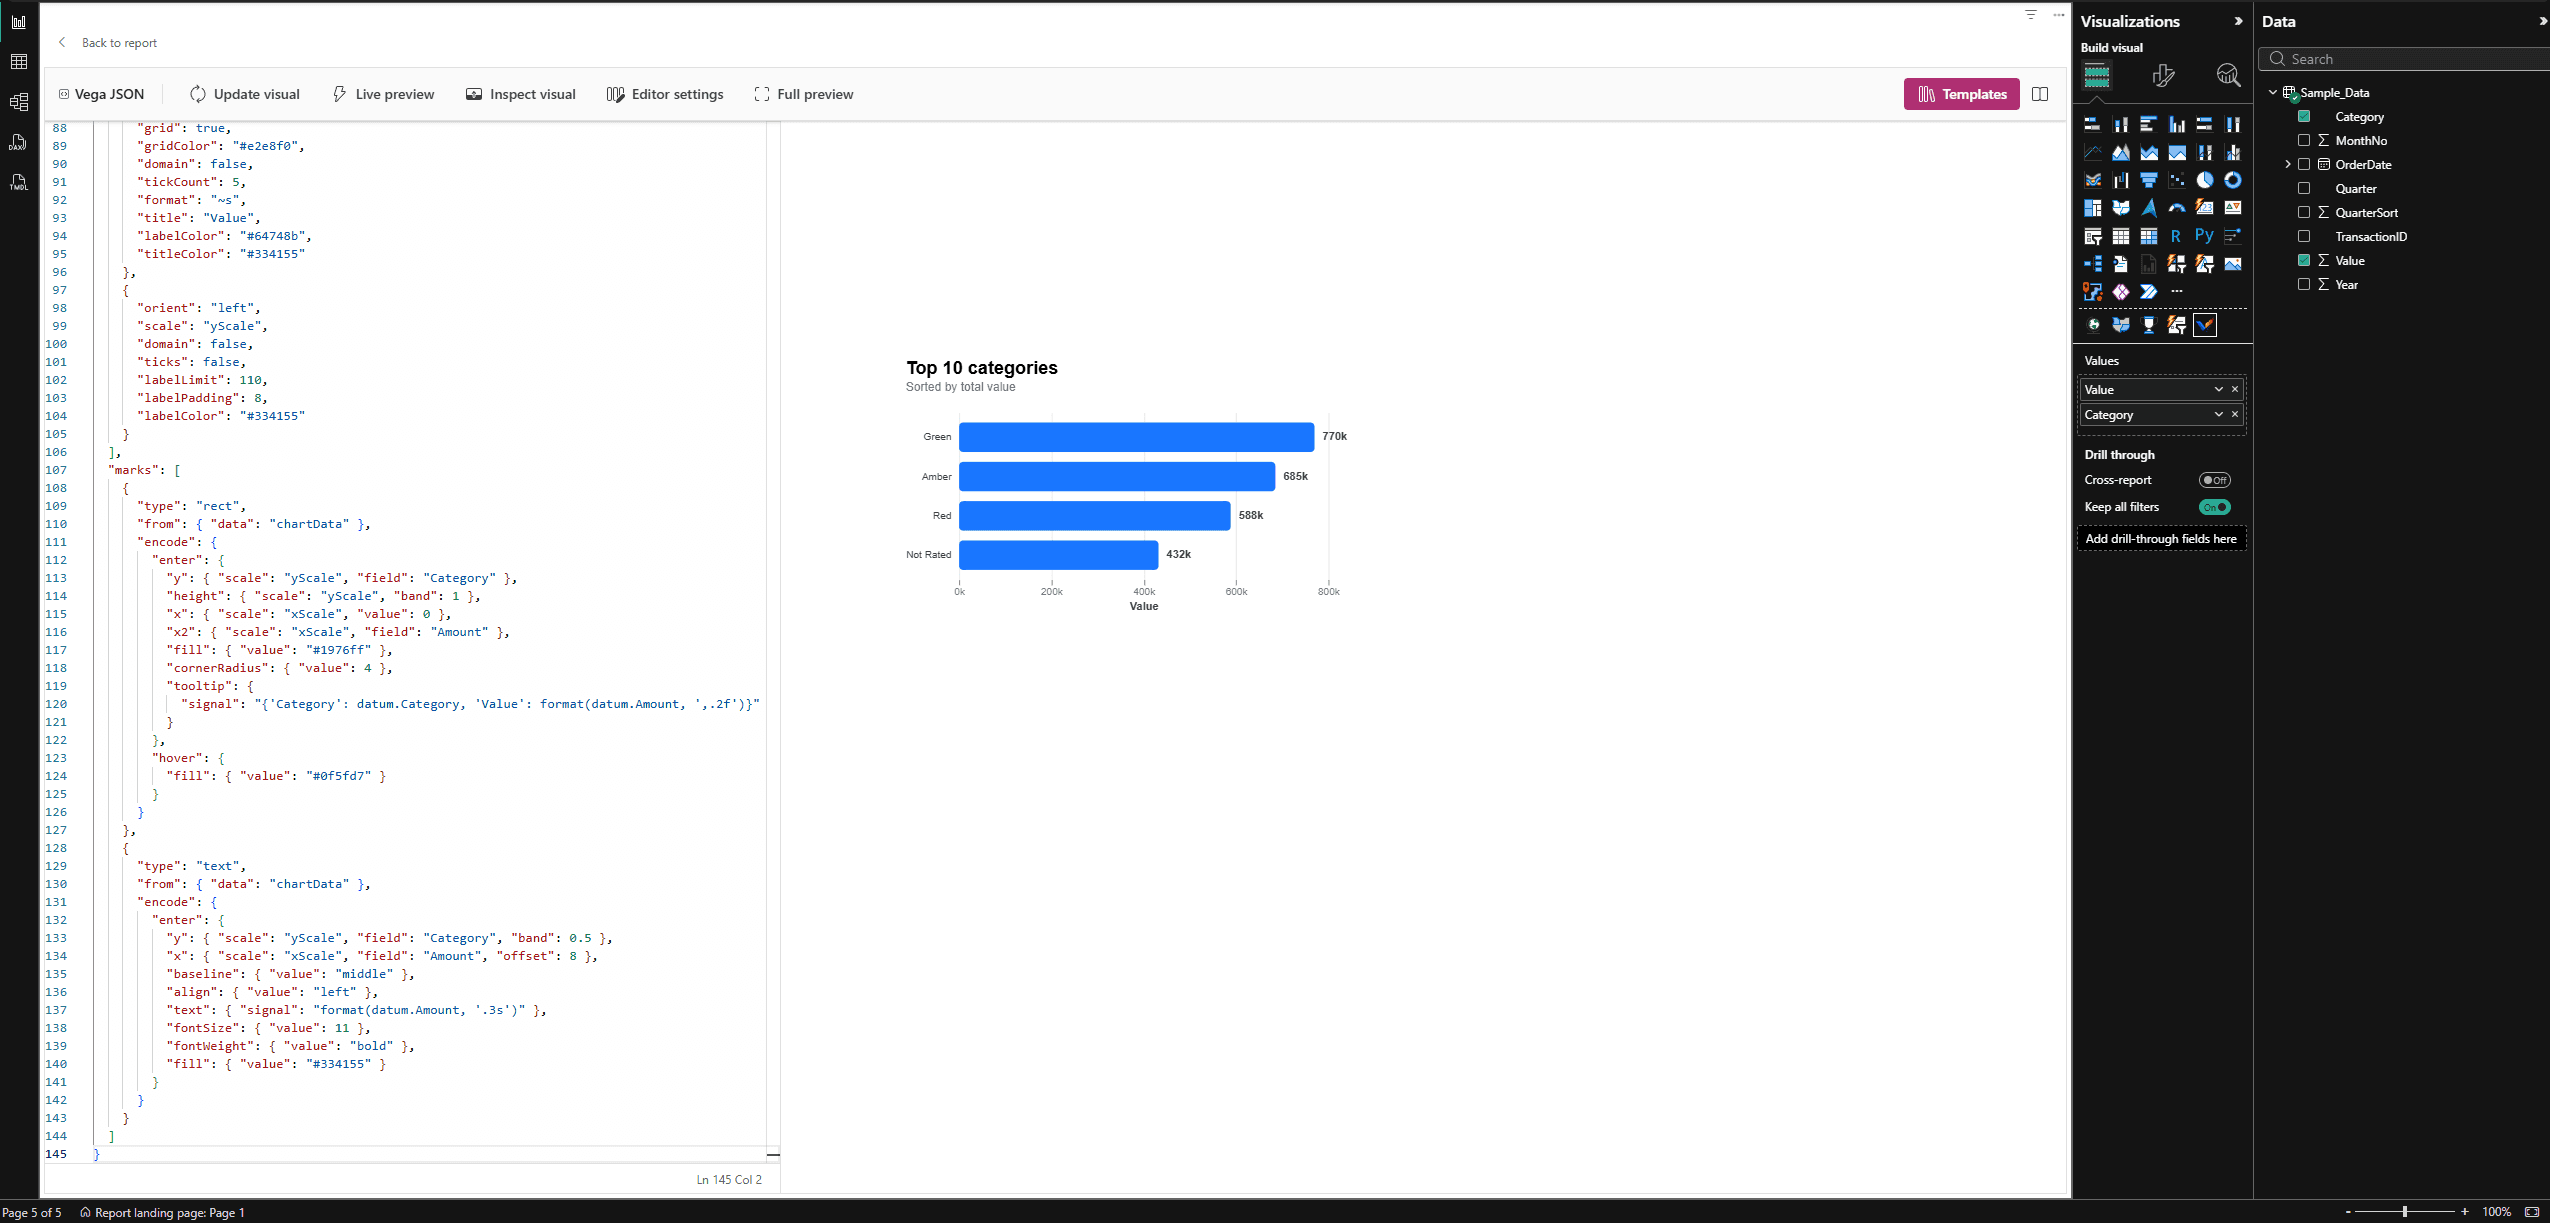
This responsive horizontal bar chart aggregates the selected measure, sorts categories by value, and limits the result to the top 10 so labels remain readable.
| Example field | Assign and replace with |
|---|---|
Category | A text category such as Region, Product Category, or City. Use Find and Replace All so every Category reference changes. |
Value | A numeric column or measure such as Sum of Net Sales or Sum of Cost. Replace every Value reference with the exact Data table heading. |
{
  "$schema": "https://vega.github.io/schema/vega/v6.json",
  "description": "Responsive top 10 horizontal bar chart for Power BI.",
  "width": 640,
  "height": 360,
  "autosize": {
    "type": "fit",
    "contains": "padding",
    "resize": true
  },
  "padding": {
    "left": 120,
    "right": 80,
    "top": 60,
    "bottom": 50
  },
  "title": {
    "text": "Top 10 categories",
    "subtitle": "Sorted by total value",
    "anchor": "start",
    "fontSize": 18,
    "subtitleFontSize": 12,
    "subtitleColor": "#64748b",
    "offset": 20
  },
  "data": [
    { "name": "dataset" },
    {
      "name": "chartData",
      "source": "dataset",
      "transform": [
        {
          "type": "filter",
          "expr": "isValid(datum['Category']) && isValid(datum['Value'])"
        },
        {
          "type": "aggregate",
          "groupby": ["Category"],
          "fields": ["Value"],
          "ops": ["sum"],
          "as": ["Amount"]
        },
        {
          "type": "collect",
          "sort": { "field": "Amount", "order": "descending" }
        },
        {
          "type": "window",
          "ops": ["row_number"],
          "as": ["Rank"]
        },
        {
          "type": "filter",
          "expr": "datum.Rank <= 10"
        }
      ]
    }
  ],
  "scales": [
    {
      "name": "xScale",
      "type": "linear",
      "domain": { "data": "chartData", "field": "Amount" },
      "range": "width",
      "nice": true,
      "zero": true
    },
    {
      "name": "yScale",
      "type": "band",
      "domain": {
        "data": "chartData",
        "field": "Category",
        "sort": {
          "op": "sum",
          "field": "Amount",
          "order": "descending"
        }
      },
      "range": "height",
      "padding": 0.25
    }
  ],
  "axes": [
    {
      "orient": "bottom",
      "scale": "xScale",
      "grid": true,
      "gridColor": "#e2e8f0",
      "domain": false,
      "tickCount": 5,
      "format": "~s",
      "title": "Value",
      "labelColor": "#64748b",
      "titleColor": "#334155"
    },
    {
      "orient": "left",
      "scale": "yScale",
      "domain": false,
      "ticks": false,
      "labelLimit": 110,
      "labelPadding": 8,
      "labelColor": "#334155"
    }
  ],
  "marks": [
    {
      "type": "rect",
      "from": { "data": "chartData" },
      "encode": {
        "enter": {
          "y": { "scale": "yScale", "field": "Category" },
          "height": { "scale": "yScale", "band": 1 },
          "x": { "scale": "xScale", "value": 0 },
          "x2": { "scale": "xScale", "field": "Amount" },
          "fill": { "value": "#1976ff" },
          "cornerRadius": { "value": 4 },
          "tooltip": {
            "signal": "{'Category': datum.Category, 'Value': format(datum.Amount, ',.2f')}"
          }
        },
        "hover": {
          "fill": { "value": "#0f5fd7" }
        }
      }
    },
    {
      "type": "text",
      "from": { "data": "chartData" },
      "encode": {
        "enter": {
          "y": { "scale": "yScale", "field": "Category", "band": 0.5 },
          "x": { "scale": "xScale", "field": "Amount", "offset": 8 },
          "baseline": { "value": "middle" },
          "align": { "value": "left" },
          "text": { "signal": "format(datum.Amount, '.3s')" },
          "fontSize": { "value": 11 },
          "fontWeight": { "value": "bold" },
          "fill": { "value": "#334155" }
        }
      }
    }
  ]
}
Choose manual or live preview
| Mode | Use for | Behavior |
|---|---|---|
| Manual update | You are making structural changes or temporarily have incomplete JSON. | Changes remain staged until you choose Update visual or press Ctrl+Enter. |
| Live preview | You are refining values, colors, labels, or small valid expressions. | The Studio reapplies changes while you type after a short debounce period. Toggle with Ctrl+Shift+Enter. |