









Refine and validate
Preview and rendering
Choose between SVG and Canvas, control preview zoom and boundaries, and validate responsive behavior before returning to the report canvas.
Choose a render mode
| Mode | Strengths | Considerations |
|---|---|---|
| SVG | Sharp at any zoom, inspectable vector output, strong choice for lower mark counts and precise lines or text. | Large numbers of SVG elements can become expensive to render and update. |
| Canvas | Usually faster for dense visuals with many marks and frequent redraws. | Raster output does not remain vector-sharp at every zoom and individual marks are not DOM elements. |
Preview zoom
The zoom controls sit on the right of the inspector toolbar, so open the inspector with Ctrl + backquote if you cannot see them. The preview zooms from 10% to 400% in 10% steps, and the percentage itself opens a picker with presets at 33%, 50%, 66%, 100%, 200%, and 400%, plus fit-to-preview and a custom value. Zoom affects only what you see while authoring — it has no bearing on how the visual renders on the report canvas.
| Action | Shortcut |
|---|---|
| Zoom in by 10% | Ctrl+Alt+= |
| Zoom out by 10% | Ctrl+Alt+- |
| Reset to 100% | Ctrl+Alt+0 |
| Fit to preview area | Ctrl+Alt+* on the numeric keypad |
Viewport and overflow tools
- Enable Boundary to show the Power BI visual viewport while working at a different preview zoom.
- Enable Scrollbars to inspect content that deliberately exceeds the viewport or to diagnose accidental overflow.
- Set Visual background to check contrast and transparent or unfilled regions.
- Use Full preview to remove editor distractions and evaluate the visual at the available authoring size. Press
Escto return. - Read the
pbiContainersignal when a specification must react to container dimensions or scroll position.
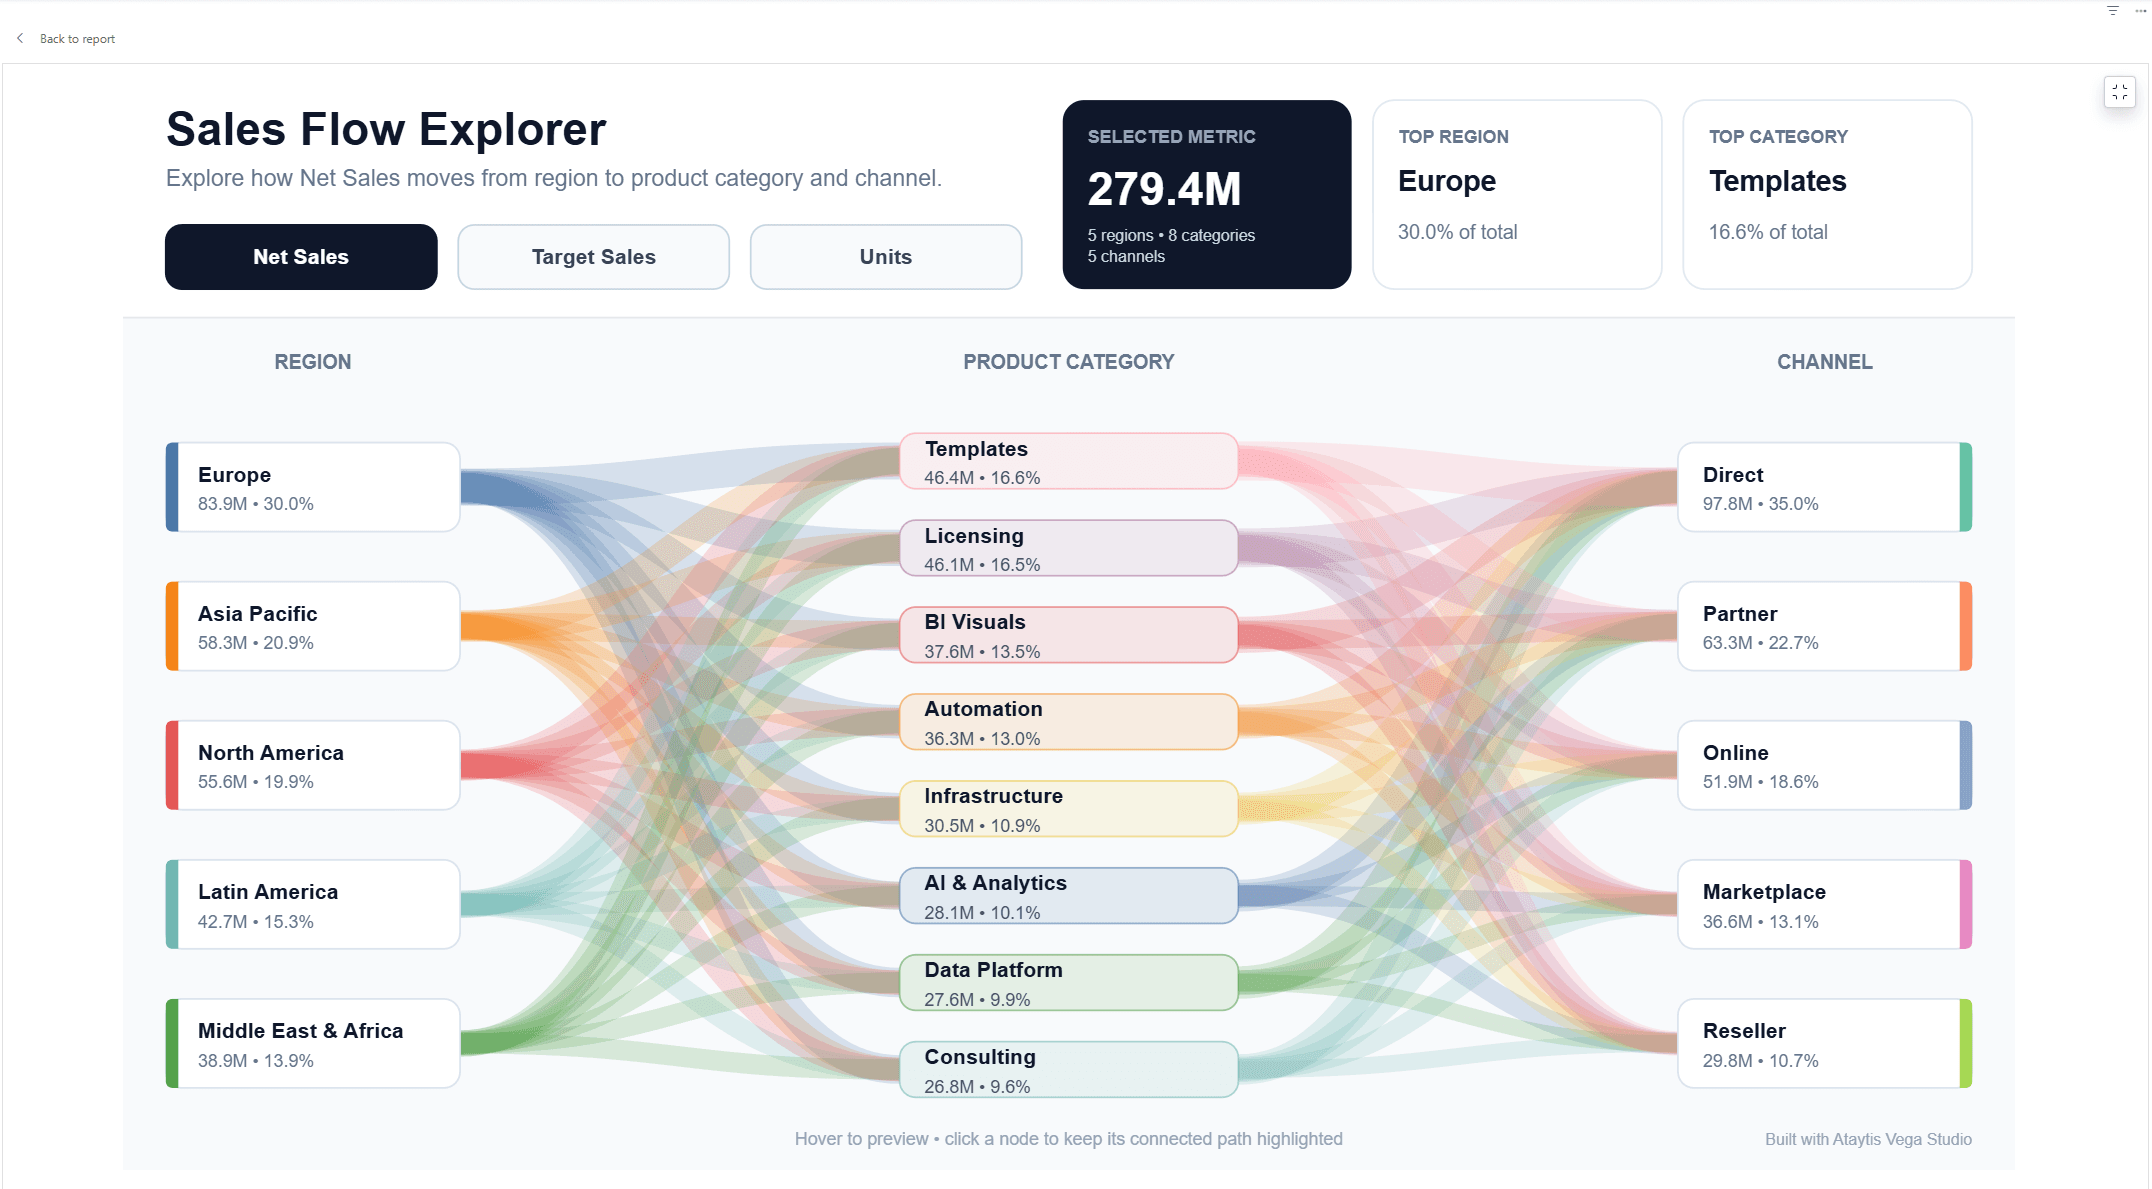
Responsive validation checklist
- Test narrow, standard, and wide report-canvas sizes.
- Confirm axes, labels, legends, and annotations do not collide at smaller dimensions.
- Check the visual at 100% preview before relying on a zoomed-out fit view.
- Test Canvas and SVG separately if users may switch renderer settings.
- Return to the report canvas and test Power BI focus mode, filters, bookmarks, and cross-visual interactions.