









How do you sort Matrix rows by one month?
In our native Matrix test, Product and Total were sortable, but the individual months were not. Jan, Feb and Mar came from a Month field in Columns. To make them separately sortable in the native visual, we created one measure per month, put those measures in Values, and left Columns empty.
That works for a few fixed periods. To keep Month in Columns and sort by a displayed month directly,Ataytis Matrix supports that layout. If sorting by the overall Total is enough, you do not need either workaround.
Sorting the rows is not rearranging the columns
Here, “sort by January” means move each whole product row according to its January value. It does not mean move January to the first column or sort the numbers in each column independently.
| Product | Feb | Jan | Mar | Total |
|---|---|---|---|---|
| A | 300 | 100 | 200 | 600 |
| B | 100 | 250 | 400 | 750 |
| C | 220 | 150 | 170 | 540 |
| Product | Feb | Jan | Mar | Total |
|---|---|---|---|---|
| A | 300 | 100 | 200 | 600 |
| C | 220 | 150 | 170 | 540 |
| B | 100 | 250 | 400 | 750 |
We have kept the screenshot's Feb, Jan, Mar order so you can see that the columns do not move. Putting months in calendar order is a different job: Microsoft's Sort by column setting can order month names using month numbers. It does not make January sales a clickable row-sort option.
Need to change the left-to-right order instead? See our Matrix column-sorting guide.
What happened in the native Power BI Matrix
Our setup was Product in Rows, Month in Columns, and Sales summed in Values. The Month field created the visible Jan, Feb and Mar columns. They looked like individual columns to click, but we could only sort the rows by Product or Total.
Native Matrix: Product sorting works
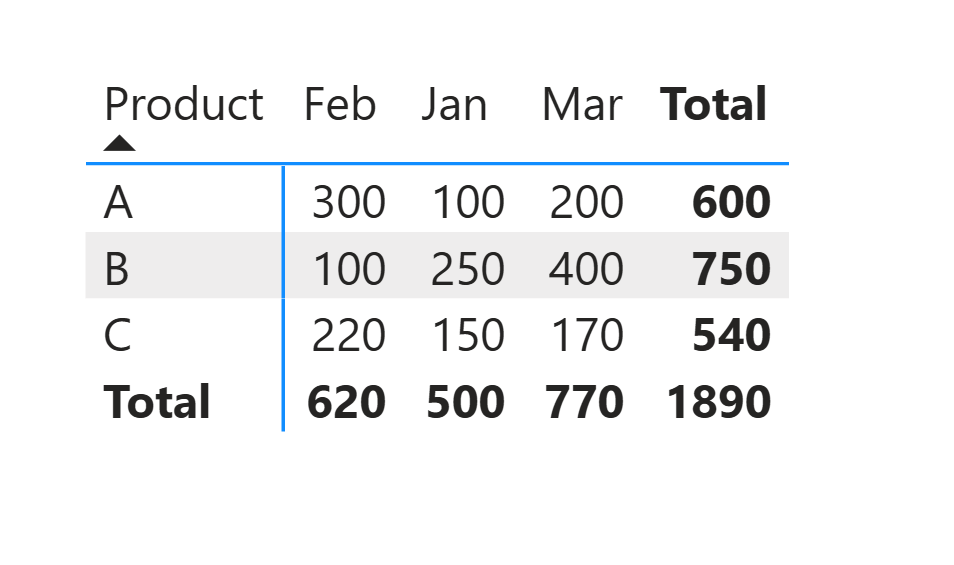
To use the native sorting that is available, click Product for name order or Total for the overall sales order, then click again to reverse the direction. For this data, Total ascending gives C → A → B (540, 600, 750). That is different from January ascending: A → C → B.
Microsoft's general sorting instructions explain the sort controls available in reports. The individual-month limitation described here is our test finding, not a quoted Microsoft specification. A Fabric Community question about sorting individual Matrix columns describes the same problem with years across the top. It is a user report, not product documentation.
Try the same numbers in your own report
Download the sample CSV and import it with Get data → Text/CSV. It contains nine Product–Month–Sales rows recreated from the screenshot values, with no precomputed totals. It is not an export of the original test file.
Name the imported table MatrixSortTest and check that Sales is a number. Put Product in Rows, Month in Columns, and Sales in Values with Sum selected. You should get January 500, February 620, March 770 and a grand total of 1,890.
To follow the measure workaround below, first choose New measure and add:
Sales Total = SUM('MatrixSortTest'[Sales])The native workaround: one measure per month
The key change is where the months come from. Instead of asking Month in Columns to create them, you add a separate measure for each period. In our test, those measure headers could sort the rows individually.
- Create Jan Sales using the formula below. Create Feb Sales and Mar Sales the same way, changing both the measure name and the month text.
- Keep Product in Rows and remove Month from Columns.
- Replace Sales in Values with Jan Sales, Feb Sales and Mar Sales. Keep the measures displayed as columns.
- Click the measure header you want to sort by. Check the arrow and click again if you need the opposite direction.
Jan Sales =
CALCULATE(
    [Sales Total],
    'MatrixSortTest'[Month] = "Jan"
)
CALCULATE evaluates Sales Total with a January filter. Repeat with "Feb" and "Mar" for the other two measures. Create each as a measure, not a calculated column.
Native workaround: Feb Sales sorted smallest to largest
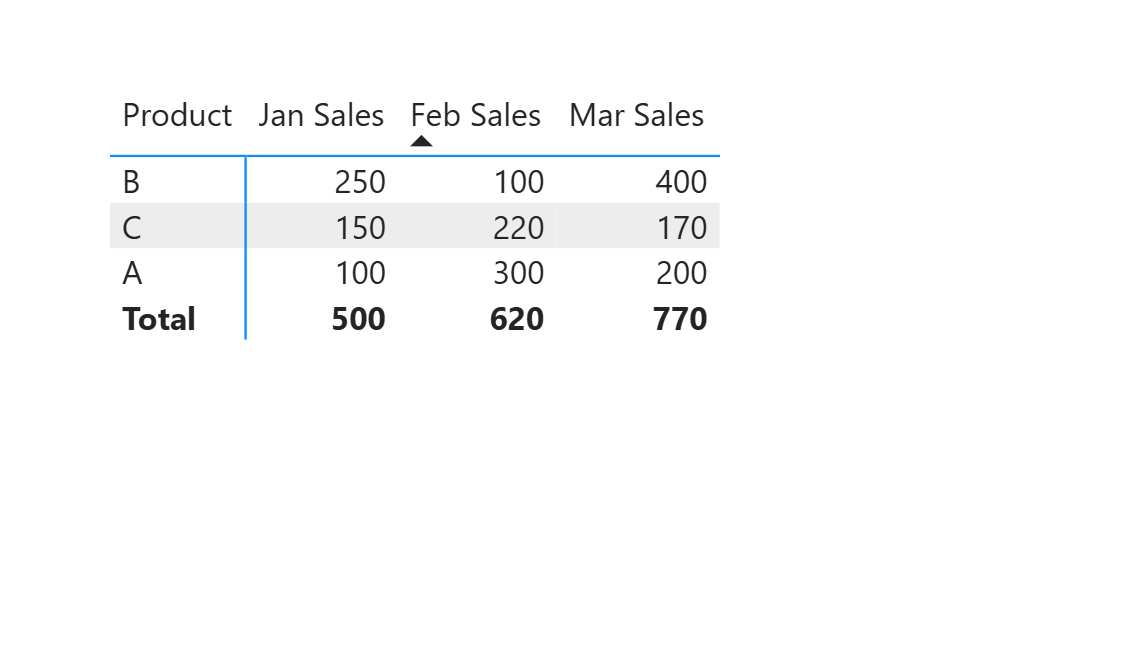
This is a reasonable solution for a fixed comparison such as three months, Actual versus Budget, or a handful of KPIs. The cost is maintaining separate measures. A new month will not appear just because it arrived in the data, and a Year → Quarter → Month column hierarchy is no longer the same layout.
The sample deliberately has no year. In a real report, “Jan” alone does not identify a particular year; make sure the date filters select the period you mean. Also check month slicers: this CALCULATE filter replaces an existing filter on the same Month column. It does not remove all other date filters.
Keep the month columns and sort them directly in Ataytis Matrix
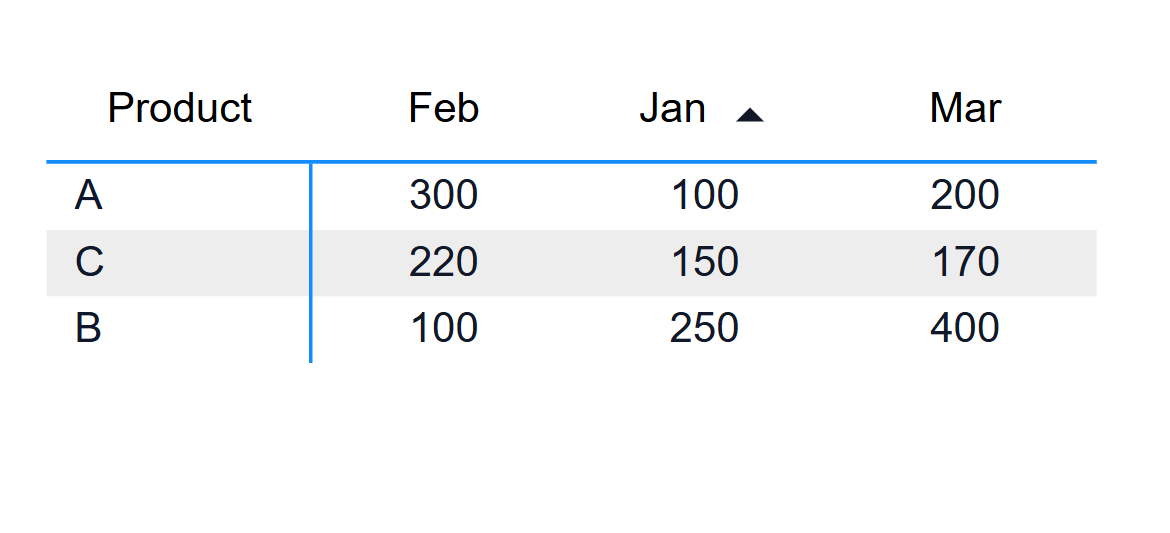
Ataytis Matrix, our custom Power BI visual, supports sorting rows by a displayed value column while keeping Month in Columns. In this test, choosing January ascending gave A → C → B without creating separate monthly measures.
Ataytis Matrix: Jan ascending, with Month still in Columns
- Keep Product in Rows, Month in Columns, and your sales value in Values.
- In the Format pane, open Data & Features and enable Sort value columns.
- Click the displayed month header you want to sort by and check the direction. In the example, Jan ascending puts 100 first.
The Data & Features documentation covers this setting and the separate Sort column grand total option. That second setting is for ranking by the total across periods, rather than one displayed month.
The benefit is letting a reader choose a period without redesigning the Matrix for each choice. The trade-off is using a custom visual: check your organization's permissions and installation and licensing requirements. The screenshots establish this three-product example, not every combination of nested rows, multiple measures and data volume.
Which approach should you use?
- Product names or overall performance: keep the native Matrix and sort by the row label or Total.
- A few fixed periods or KPIs: separate measures are a practical native solution if you can maintain them.
- Readers choose among changing month columns: consider Ataytis Matrix if keeping that layout and clicking any displayed period is important.
- Only one month needs to be visible: another option is to filter the native Matrix to that month and sort its Total. You lose the side-by-side period comparison; this is not a way to make every month header sortable.
If the order still looks wrong
- The month header does nothing.
- Check whether Month is still in the native Matrix’s Columns field. For the separate-measure workaround, Columns must be empty. In Ataytis Matrix, check Sort value columns in Data & Features.
- The products are ranked by the wrong numbers.
- Look at the active sort arrow and compare that column’s values. Our native workaround screenshot sorts February; the Ataytis screenshot sorts January. Total sorting can produce a third order.
- February is still before January.
- That is the order of the columns, not the product rows. Sorting rows by January does not put the months into calendar order.
- My rows have groups or tied values.
- Our example has one Product level and no ties. Check the order within each expanded group in your own report; it is not evidence that all hierarchy levels will become one flat ranking. Equal values also do not establish a unique row order.
If you need to find a product rather than rank the list, see our Matrix search bar guide. For missing period columns, see our native Matrix 100-column limit test.