









How do you change Matrix column order?
For columns created from a field such as Month, give that field a numeric sort key and select Column tools → Sort by column. Month sorted by MonthSort gives Jan → Feb → Mar without changing the product row order. This is a native Power BI feature.
If you want to move product rows according to January's values, use our Matrix row-sorting guide instead. This guide changes the columns' left-to-right order.
- Months or a fixed business sequence: use a model sort key, or Ataytis Matrix's direct calendar/custom order settings.
- Highest-selling products first after each data refresh: calculate an index in Power Query and use it as the sort key.
- Products rerank whenever a slicer changes: that needs a current-measure ranking, not a stored sort key. See the distinction below.
The native sort menu did not move our month columns
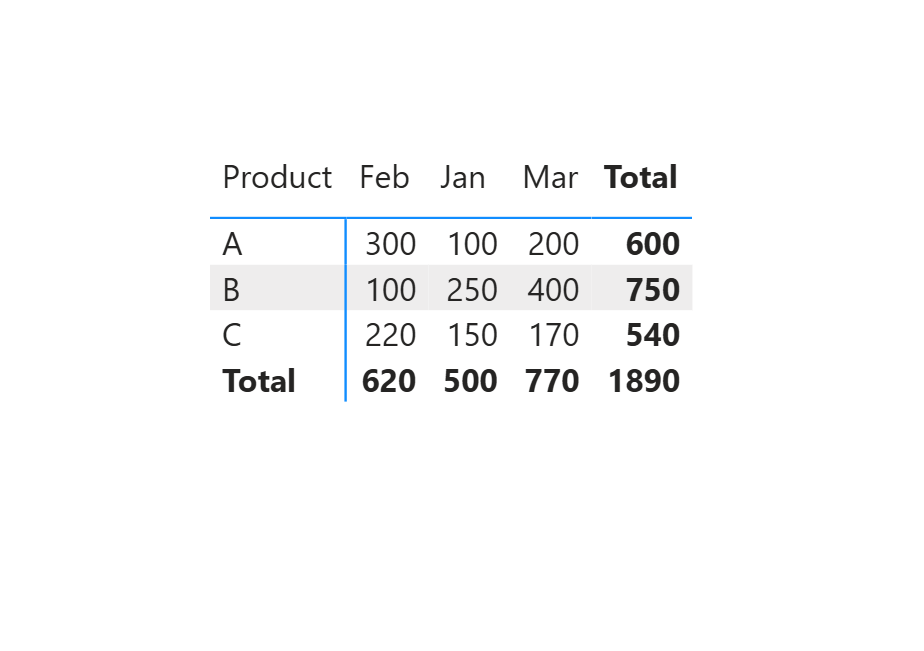
We used Product in Rows, Month in Columns and Sales summed in Values. Month contained the text labels Jan, Feb and Mar, so the initial alphabetical order was Feb → Jan → Mar.
Starting point: February before January
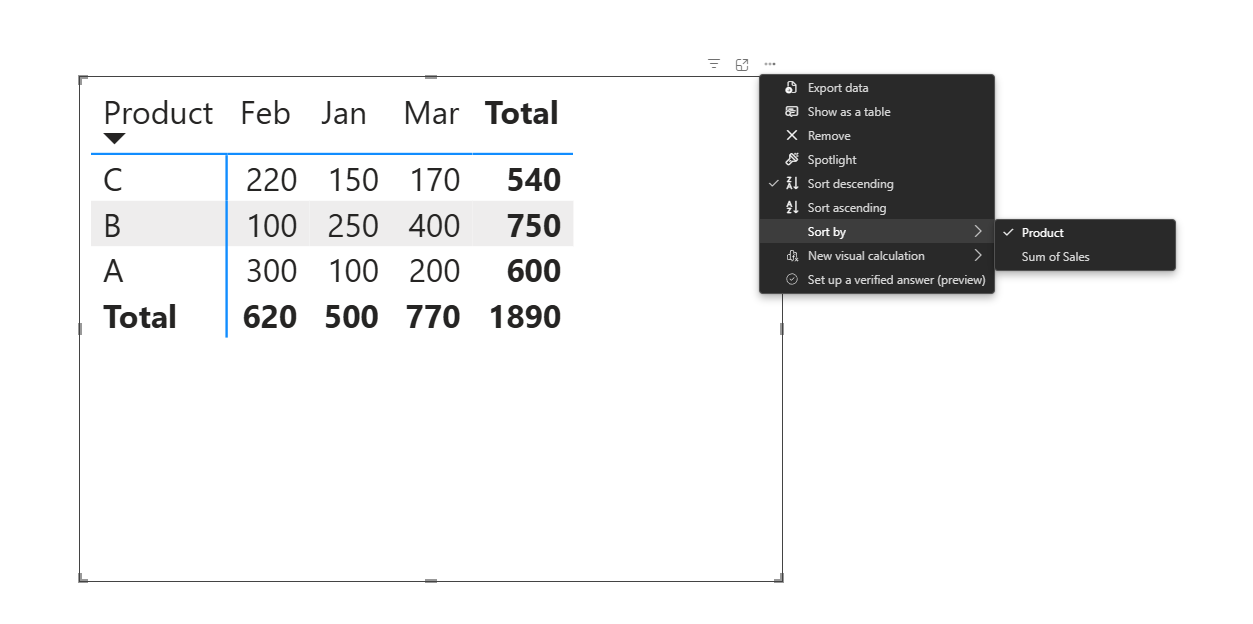
The Matrix's More options (…) → Sort by menu offered Product and Sum of Sales. Neither was a control for placing January before February.
The menu offers Product and Sum of Sales
Put the months in order with Sort by column
Add a number that represents each month's position: Jan = 1, Feb = 2, Mar = 3. Power BI can display the name while using that number to decide where it belongs.
- Open Transform data. In the query containing Month, choose Add Column → Custom Column and name it MonthSort.
- For this three-month example, enter the formula below. Set MonthSort's data type to Whole Number, then select Close & Apply.
- In Report view, select the Month column in the Data pane, not the Matrix itself. Choose Column tools → Sort by column → MonthSort.
- Make sure the Matrix's Columns field uses that same Month column. Check that the headers now read Jan, Feb, Mar.
if [Month] = "Jan" then 1
else if [Month] = "Feb" then 2
else if [Month] = "Mar" then 3
else null
This is Power Query M, not a DAX measure. It covers only the three sample labels; add the remaining months for a full year. Unknown labels return null so you can spot and fix them, rather than silently treating every other value as March. Microsoft's Sort by column instructions explain the model setting.
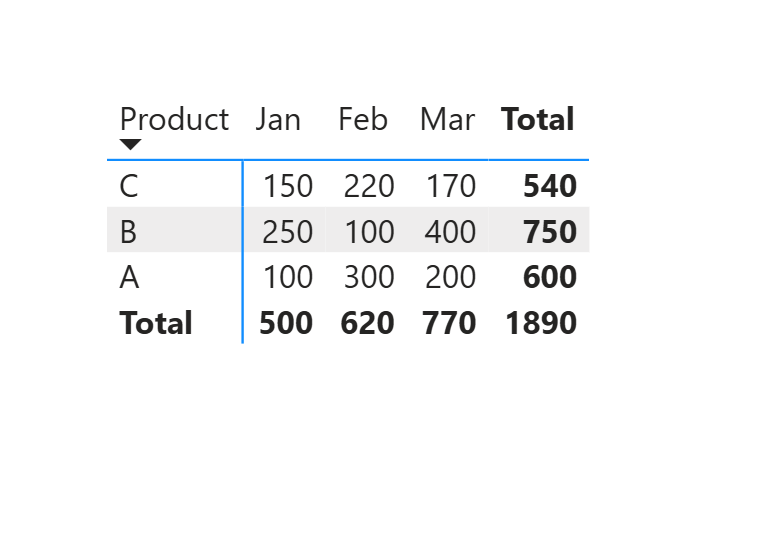
Native result: Jan, Feb, Mar
The circular-dependency error we hit
Our first helper was a DAX calculated column built from Month. Assigning it back as Month's sort column produced a circular-dependency error in our model. Creating the helper in Power Query resolved it. That is a report of this setup, not a claim that DAX sort columns always fail.
For a real calendar, use Month Name and Month Number from your date table. Across multiple years, either place Year above Month or use a Year–Month label with a matching YearMonth key, such as 202601. Sorting plain “Jan” by a key that is sometimes 202501 and sometimes 202601 is ambiguous.
The same method works for High → Medium → Low or Actual → Budget → Forecast. Keep the label and sort key in the same table, with one consistent key per label. The setting can affect other visuals using that column too; it is not a private order for this one Matrix.
Want to follow the example? Use the nine-row sample CSV from the row-sorting guide. It recreates the same displayed values; it is not an original PBIX export.
Order product columns by sales at refresh time
Suppose you want the highest-selling products on the left, but only need that order updated when the data refreshes. Power Query can prepare a ProductSort index for an Import model. For this example, Product goes in Columns, unlike the month-order screenshots above.
- Reference the sales query and group by Product, summing Sales. Use a unique Product ID instead if names are not unique.
- Sort the grouped totals from largest to smallest. Add Product ID or another stable key as a second sort to break ties.
- Immediately after sorting, add an Index Column → From 1 and name it ProductSort.
- Merge the index into the Product dimension, one row per product. Load it, then set the dimension's Product label to Sort by column → ProductSort.
- Use that dimension's Product field in the Matrix's Columns area, with the relationship to Sales in place.
The sample totals give B = 1, A = 2, C = 3. The next data refresh can change that index. Sorting the source query alone is not enough: it is the loaded index and Sort by column setting that give the Matrix its order. Microsoft documents Group by and index columns separately.
This is an additional modeling approach, not a fifth test screenshot. The refresh timing here assumes an Import model; do not assume the same Power Query steps are supported by every DirectQuery source.
Why a February slicer does not recalculate that order
Across all three months, B has the most sales. In February alone, A leads. A stored ProductSort index still says B, A, C after a February selection—it does not run the Power Query ranking again just because someone uses a slicer.
All three months: highest sales first
- B750
- A600
- C540
February only: highest sales first
- A300
- C220
- B100
Sort by column takes another column, not a measure. A DAX ranking stored in an Import calculated column is not a slicer-responsive replacement either. Microsoft's calculation options comparison distinguishes refresh-time columns from measures evaluated as people use a report.
The native Matrix has no standard column-order control that reranks Product columns by the current Sales measure. A Fabric Community discussion about dynamic column order describes the same requirement and more involved workarounds. That discussion is a user report, not an official product specification.
If ranking matters more than a horizontal layout, put Product in Rows and sort by the sales result or its Total. See our row-sorting guide for the distinction between sorting by Total and one displayed month. If columns must stay horizontal, test a solution specifically designed for measure-driven ordering; a numeric-label sort is not enough.
When your columns are measures or separate source fields
Reordering measures
If Actual, Budget and Forecast are separate measures in Values, change their order in the Values field list. You are arranging fields, not sorting members of a Month or Scenario column. That is a different case from dragging month headings around on the report canvas.
Giving readers a choice of fixed layouts
Field parameters let readers choose which fields a visual uses. One possible pattern is two Product display columns: one with business ordering and another with alphabetical ordering. A single-select parameter switches between them in Columns. It selects a prepared order; it does not calculate a new Sales ranking.
When Jan, Feb and Mar are physical source columns
If new periods keep arriving as new fields, consider unpivoting in Power Query. That turns Product | Jan | Feb | Mar into Product | Month | Sales, so Month can use one normal sort key. Keep the wide shape if it suits a small fixed report. Unpivoting improves the shape of the data; it does not add interactive ranking by itself.
Set column order directly in Ataytis Matrix
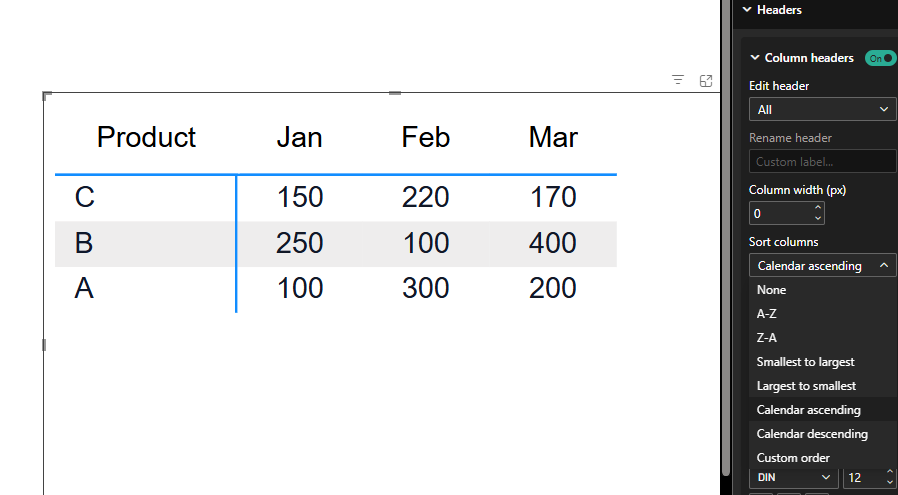
In Ataytis Matrix, our custom Power BI visual, we selected Calendar ascending and the month columns changed to Jan, Feb, Mar. This avoids creating a model sort key just to arrange the displayed month labels.
- Select Ataytis Matrix and open Format → Headers → Column headers.
- Set Sort columns to Calendar ascending for month names, or choose the ordering you need.
- For a fixed sequence of your own, choose Custom order and fill in Custom column order using the matching column labels.
Ataytis Matrix: Calendar ascending selected
| Mode | Orders by |
|---|---|
| A–Z / Z–A | The column labels alphabetically. |
| Smallest / largest | Numbers in the column labels, not the Sales values under them. |
| Calendar ascending / descending | Recognized calendar labels, as with Jan, Feb and Mar in our test. |
| Custom order | The label sequence supplied by the report author. |
The Headers documentation covers these controls. They should not be read as a promise that columns rerank by current Sales after a slicer change. The current source implementation orders labels or a custom label sequence, not the measure values shown beneath them.
For a shared calendar order across many visuals, a date-table sort key remains a good native solution. Ataytis is useful when you want direct ordering controls for this Matrix. Weigh that convenience against introducing a custom visual and its installation, permissions and licensing requirements.
If the columns still appear in the wrong order
- Sort by column is missing.
- Select the actual data column in Report view, not just the visual. You need access to edit the model; a report connected to a shared model may require its owner to add the sort key.
- Power BI will not accept the sort key.
- Check that both columns are in the same table and each label maps to one key. Repeated Jan rows can all use 1; the problem is a label that maps to different keys.
- The numbers look like 1, 10, 11, 2.
- Check the sort key’s data type. Store numeric positions as Whole Number, not text.
- I changed the key but the Matrix did not change.
- Check that Columns uses the exact field you configured, not another Month column from a different table. For a hierarchy, check the field at each level.
- The year order is mixed up.
- Use Year above Month, or a Year–Month label with a YearMonth key. Month number alone cannot distinguish January in different years.
- The ranking did not change after a slicer selection.
- A stored sort key does not become a ranking of the currently displayed measure. Decide whether you need an order at refresh time or an order recalculated for each filter selection.
If columns are missing rather than misplaced, check our native Matrix 100-column limit test. Ordering cannot make an undisplayed column appear.