AtaytisTech Visuals
Microsoft-certified Power BI custom visuals.




AtaytisTech Library
Vega specifications you configure here and paste in.






Toolkit. Build faster with ready-made assets.
20 products
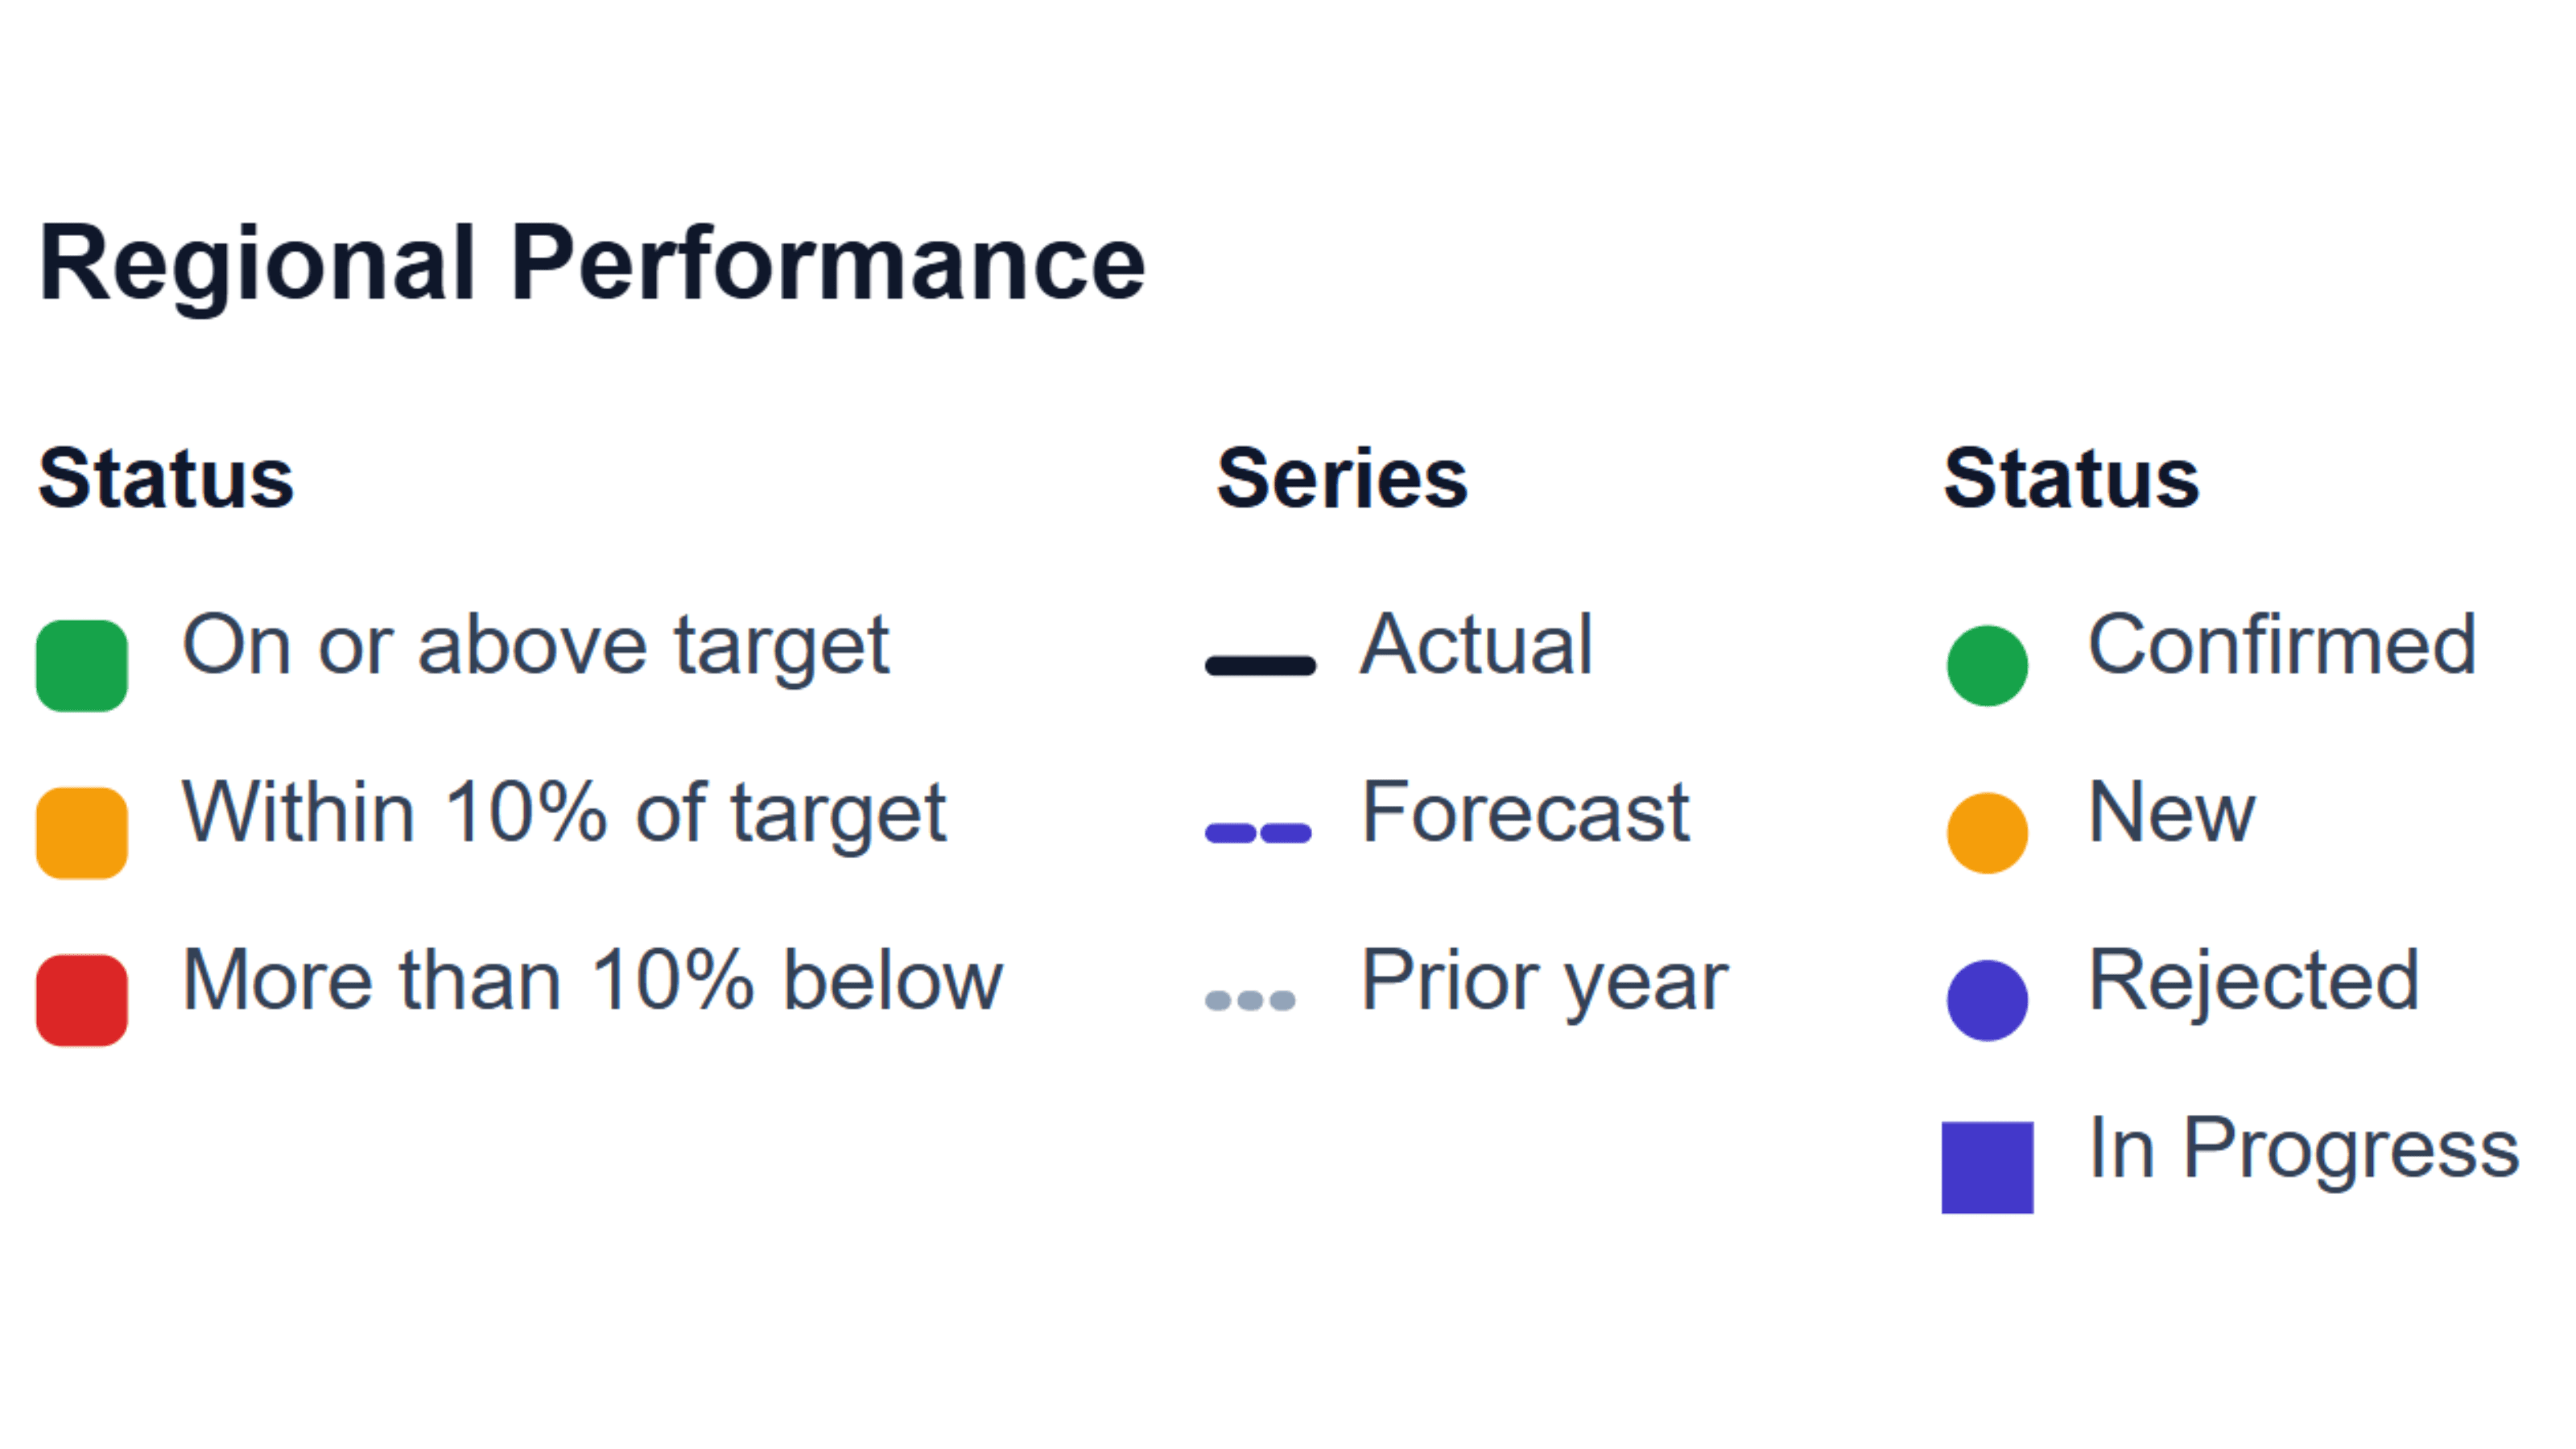
Signpost
A standalone legend for a Power BI report — explain your thresholds, map colours and line styles in one place, with no data fields required.
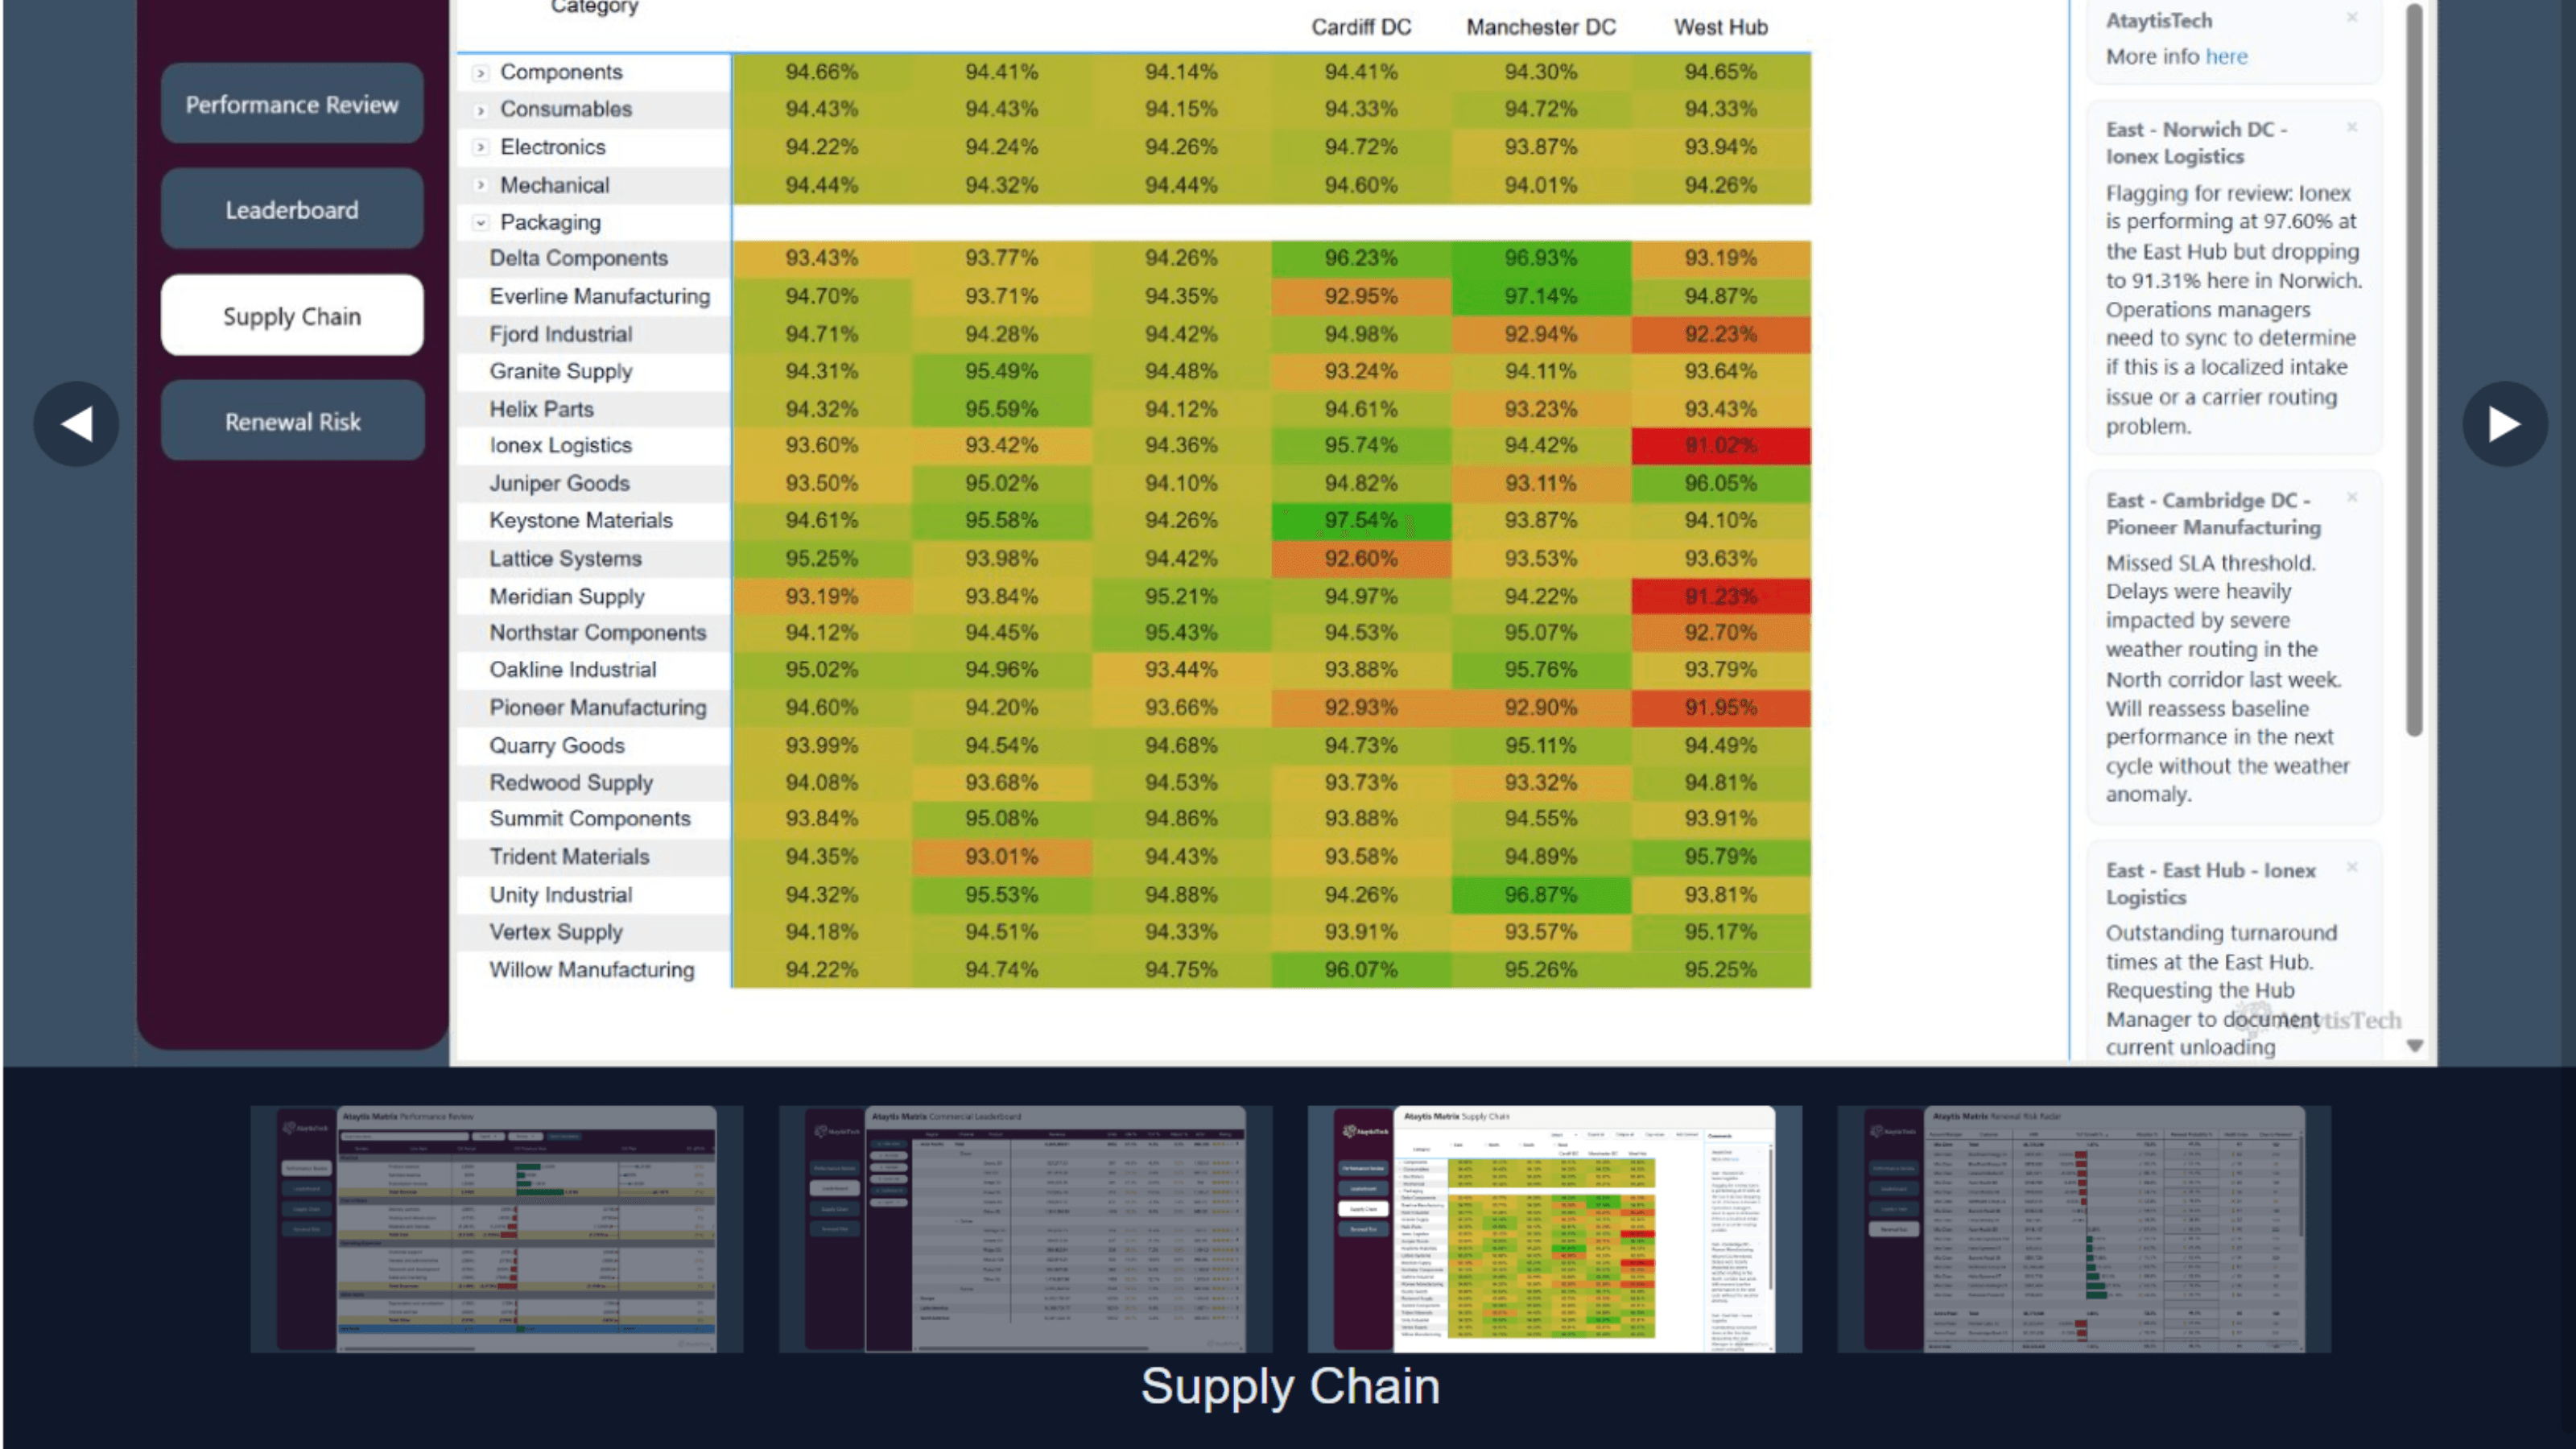
Image Carousel
Several images in one Power BI visual — as a carousel, grid, collage or filmstrip, with proper aspect-ratio handling and zoom.
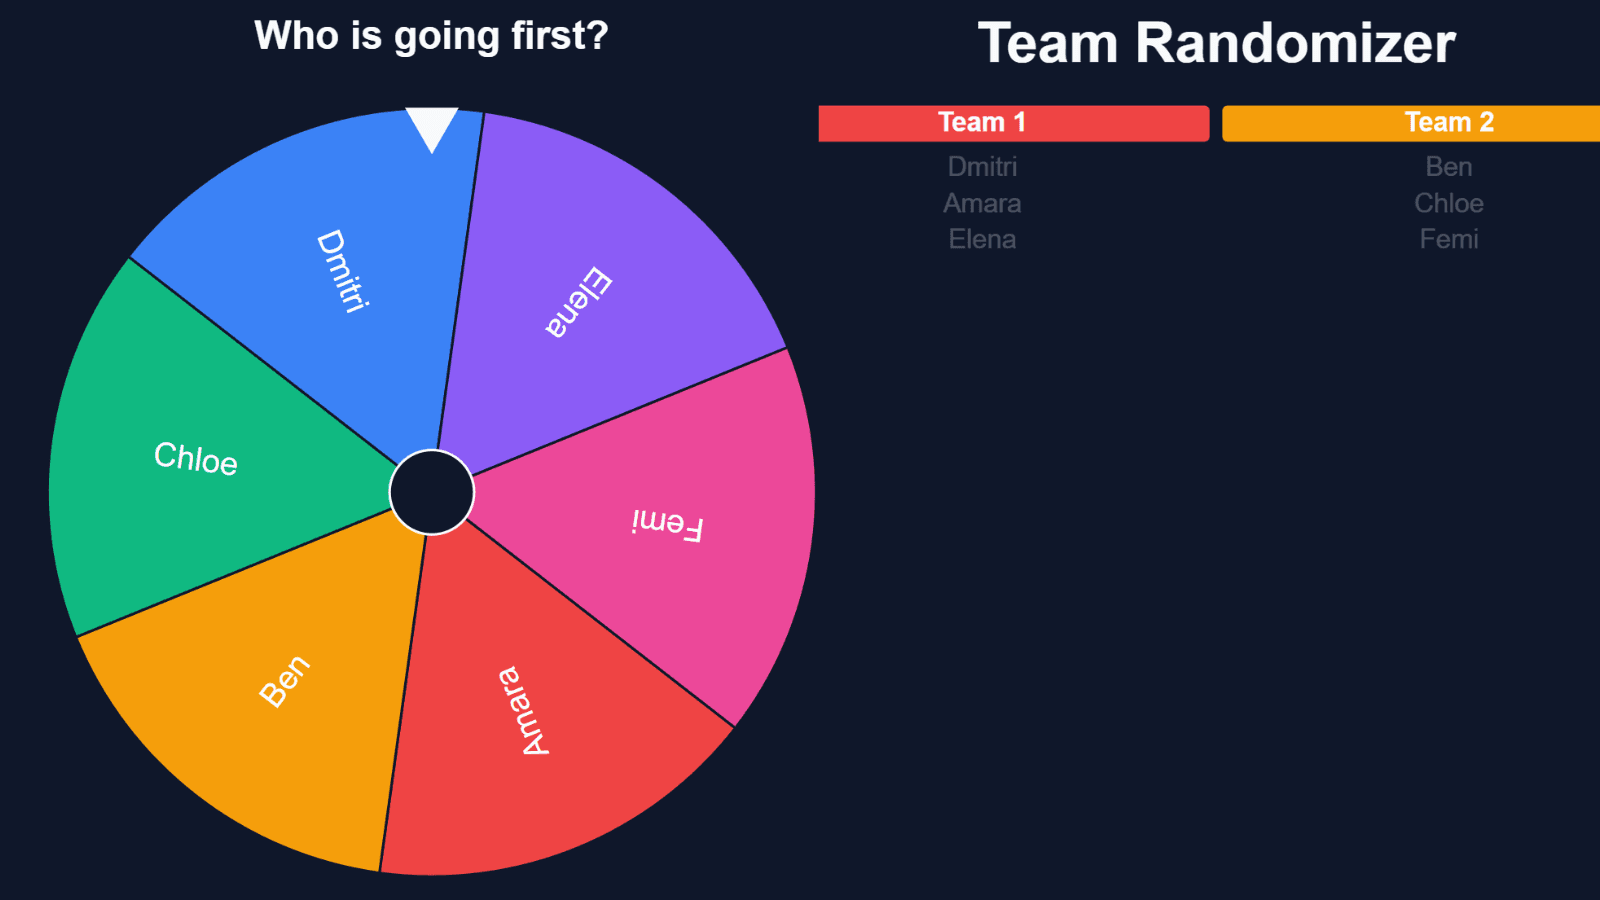
Power Draw
A spin wheel and randomiser for Power BI — pick a name, shuffle teams, roll dice or flip a coin, without leaving the report.
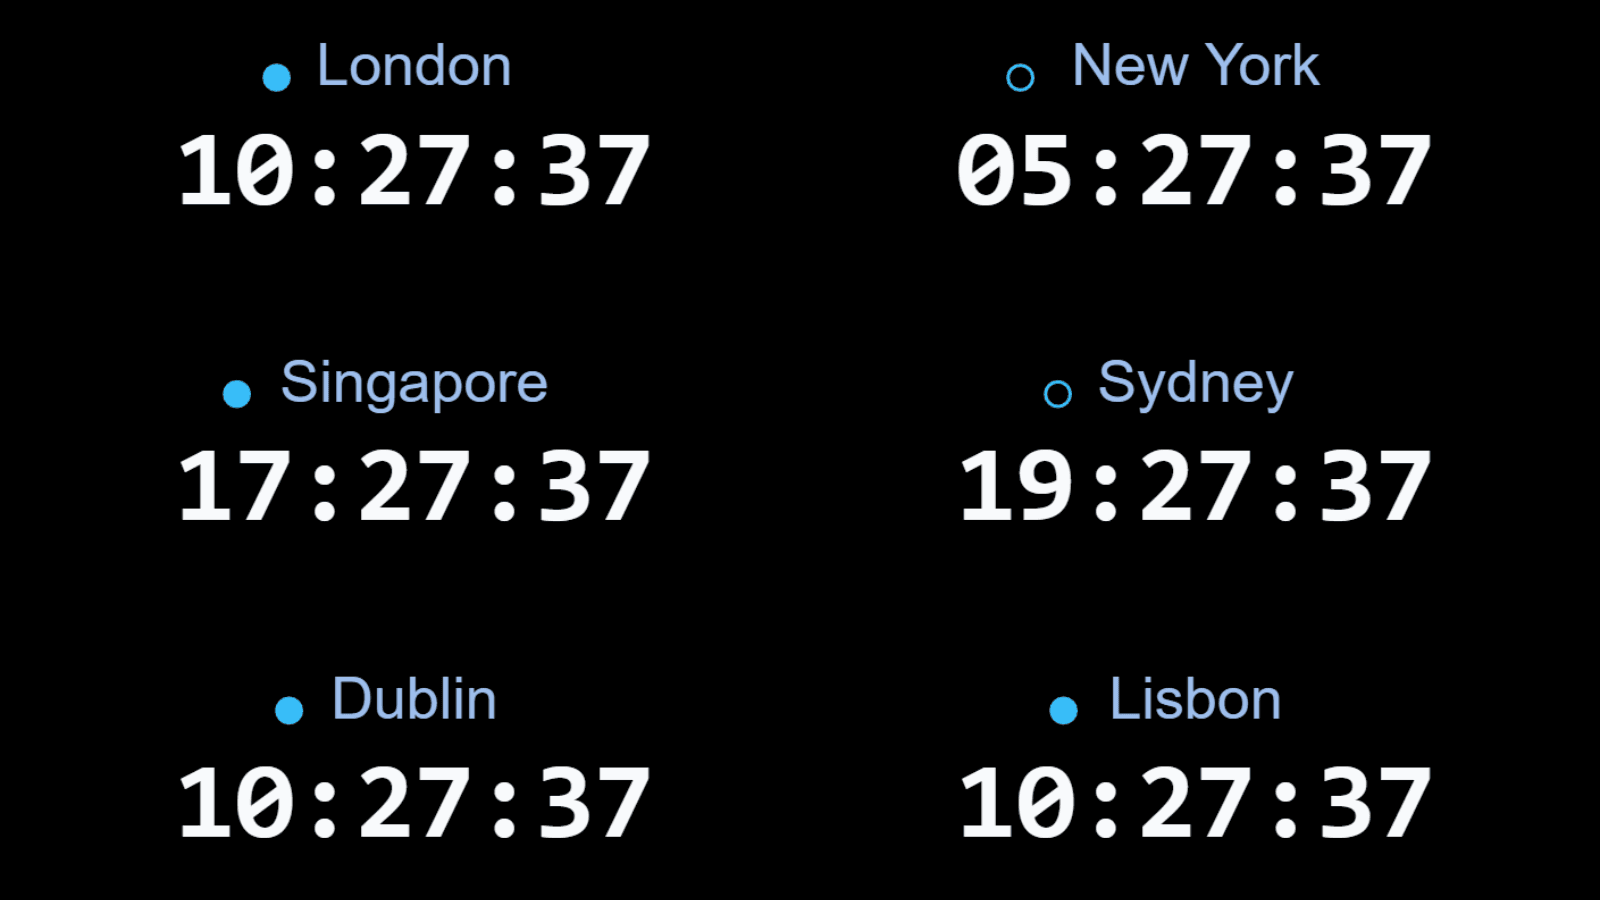
World Clock
A digital clock and world time zone board for Power BI — show the local time in every office on the report everyone already has open.
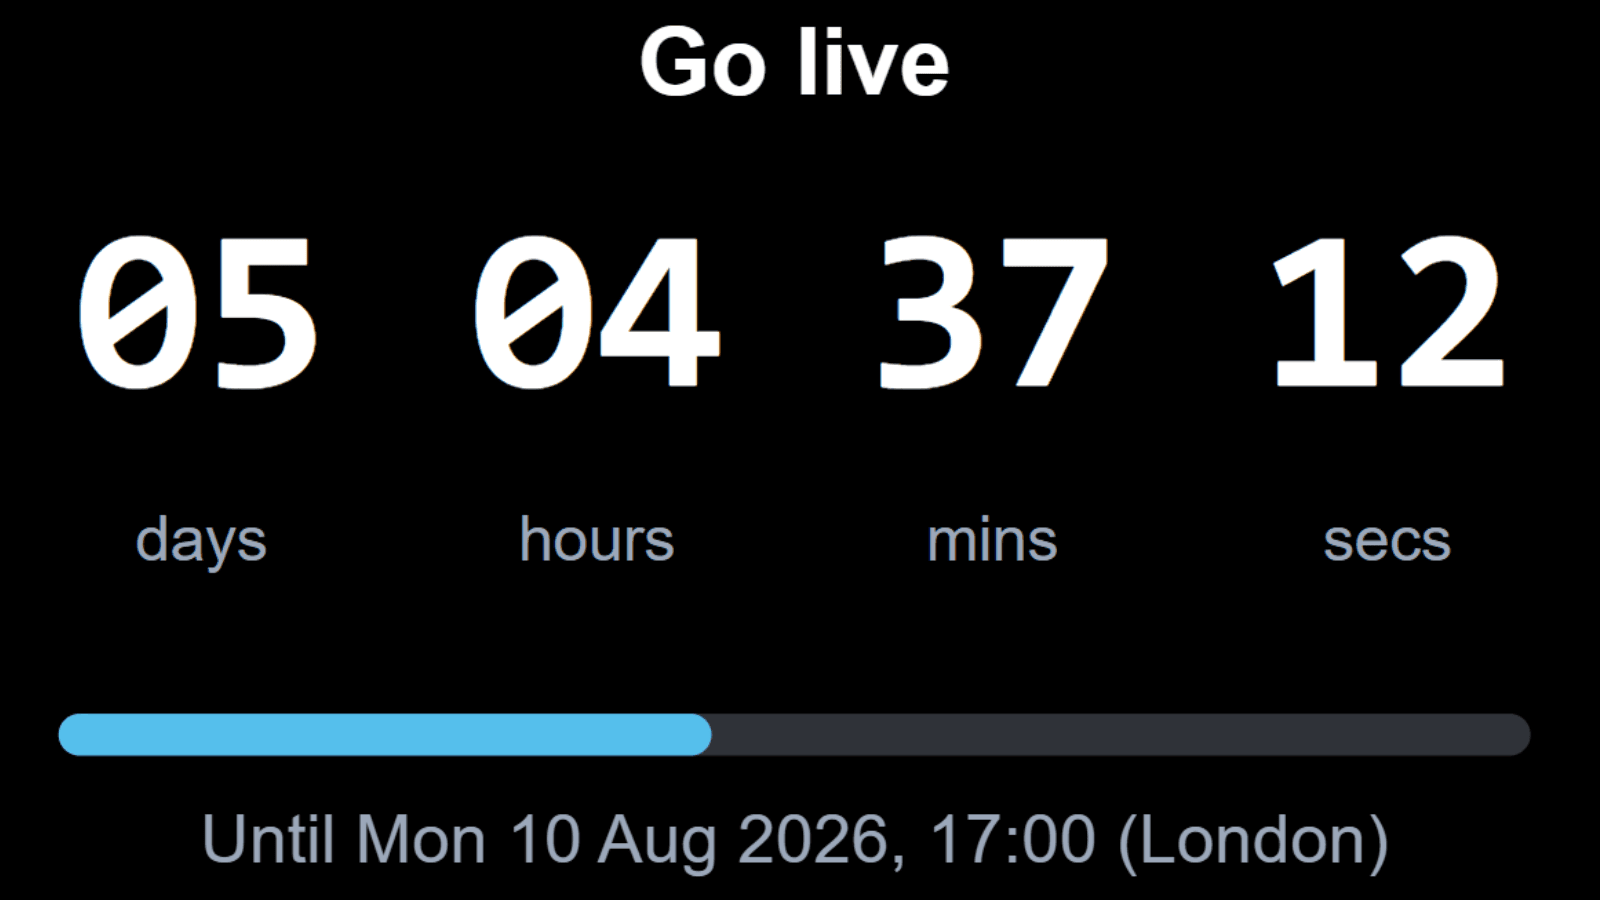
Countdown Timer
A live countdown to any date inside Power BI — days, hours, minutes and seconds to a deadline, or the time elapsed since one.
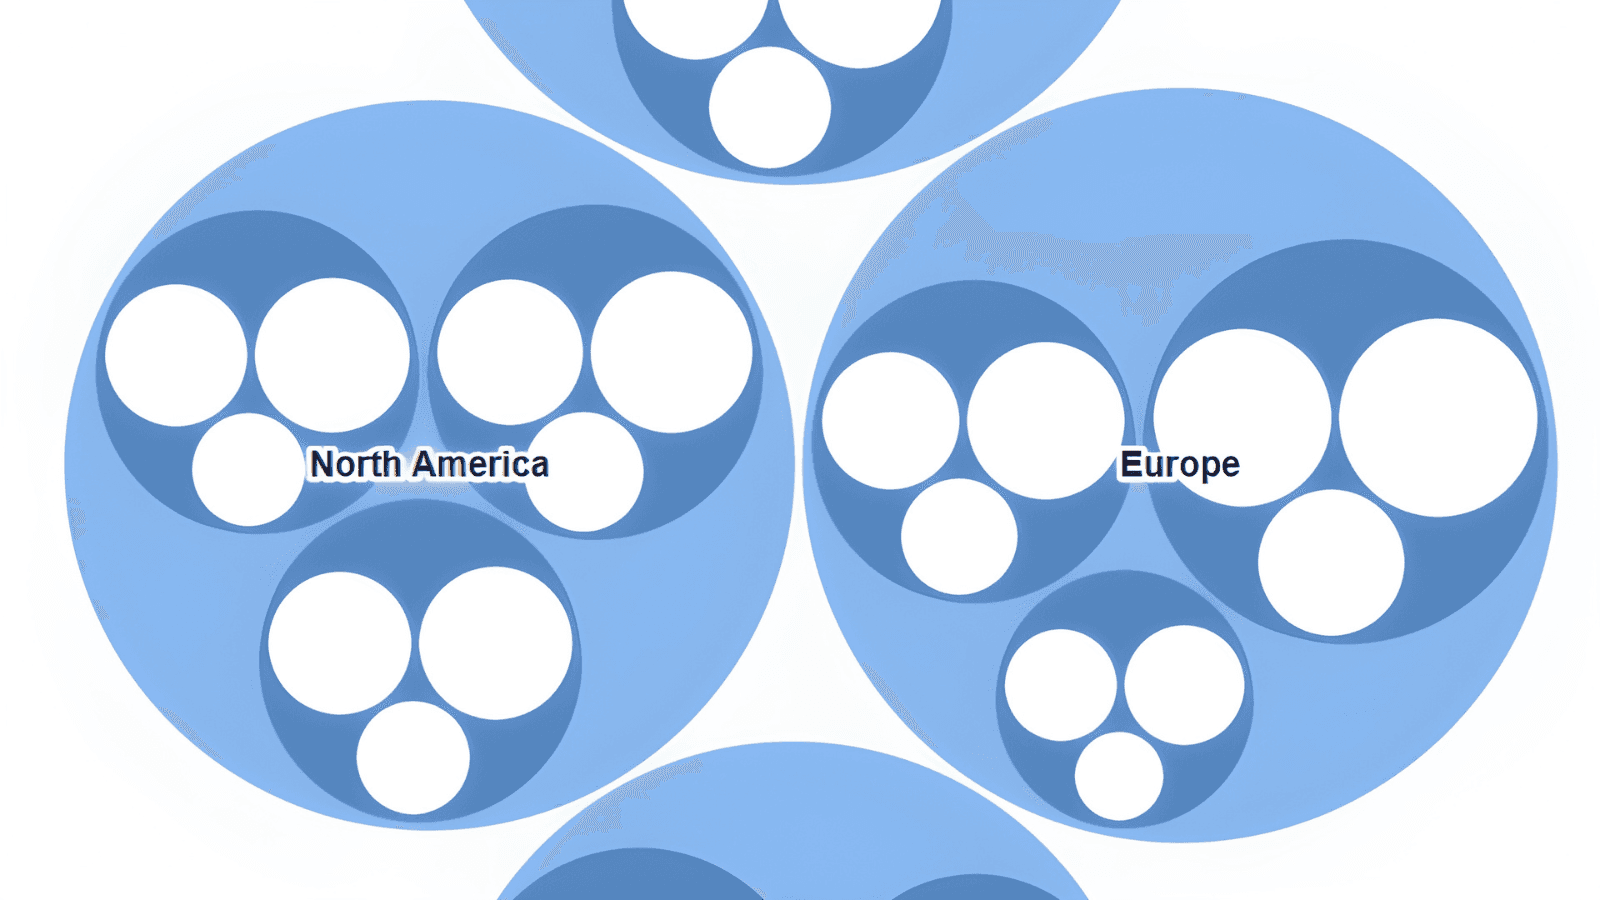
Circle Pack
A zoomable circle packing chart for Power BI — nested circles sized by your data, with click-to-zoom drill down through the hierarchy.
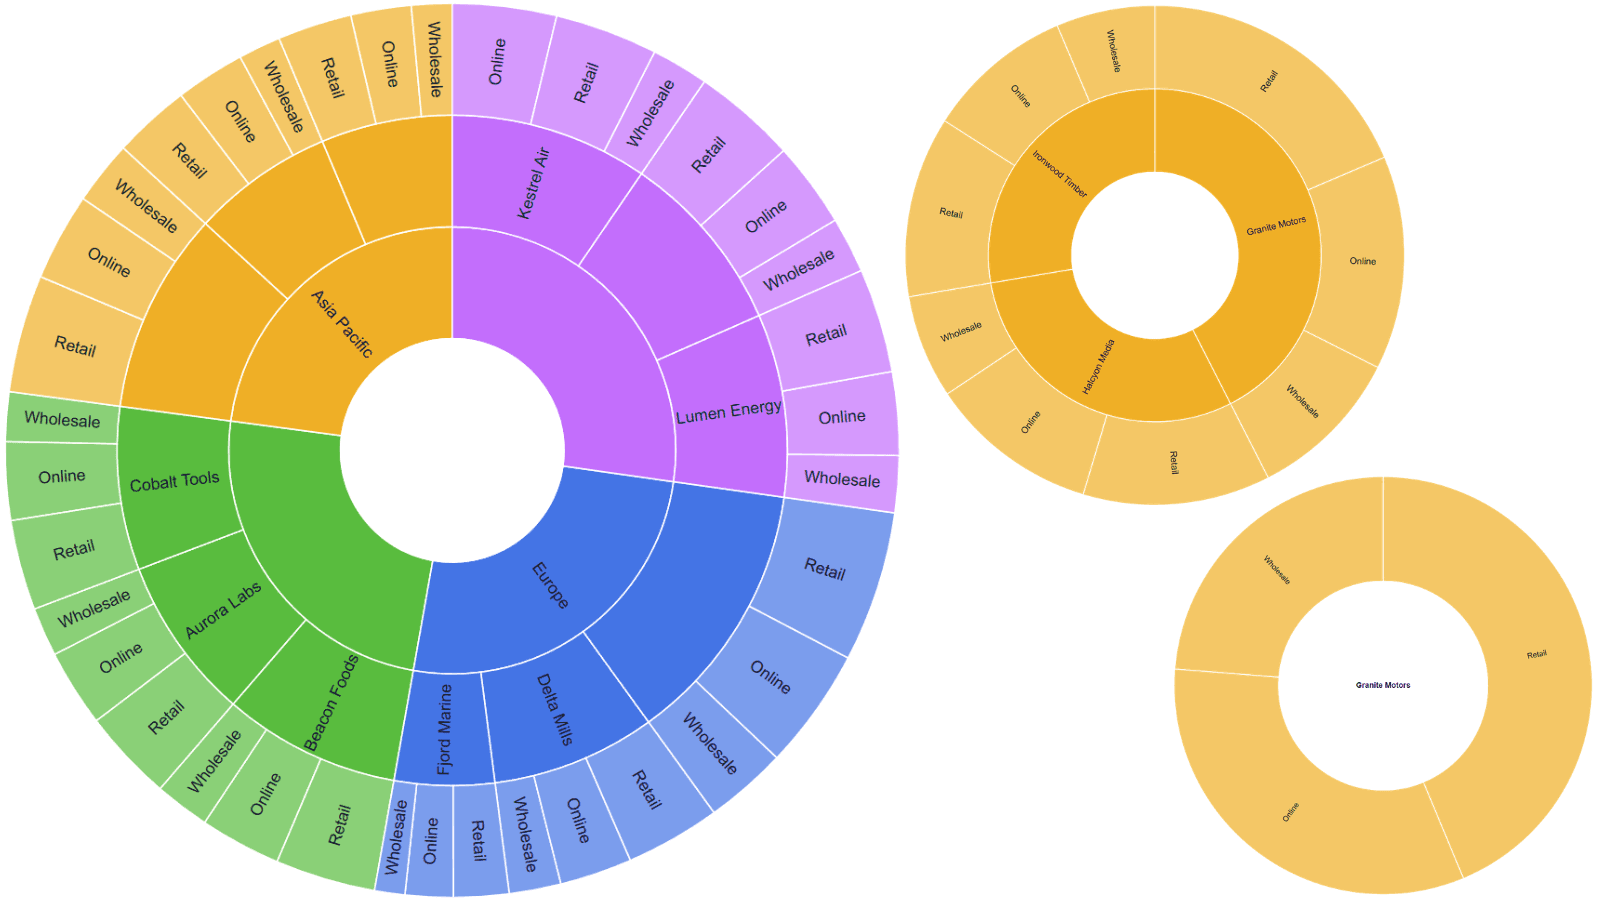
Sunburst
A zoomable sunburst chart for Power BI — nested rings sized by your data, with click-to-zoom drill down through the hierarchy.
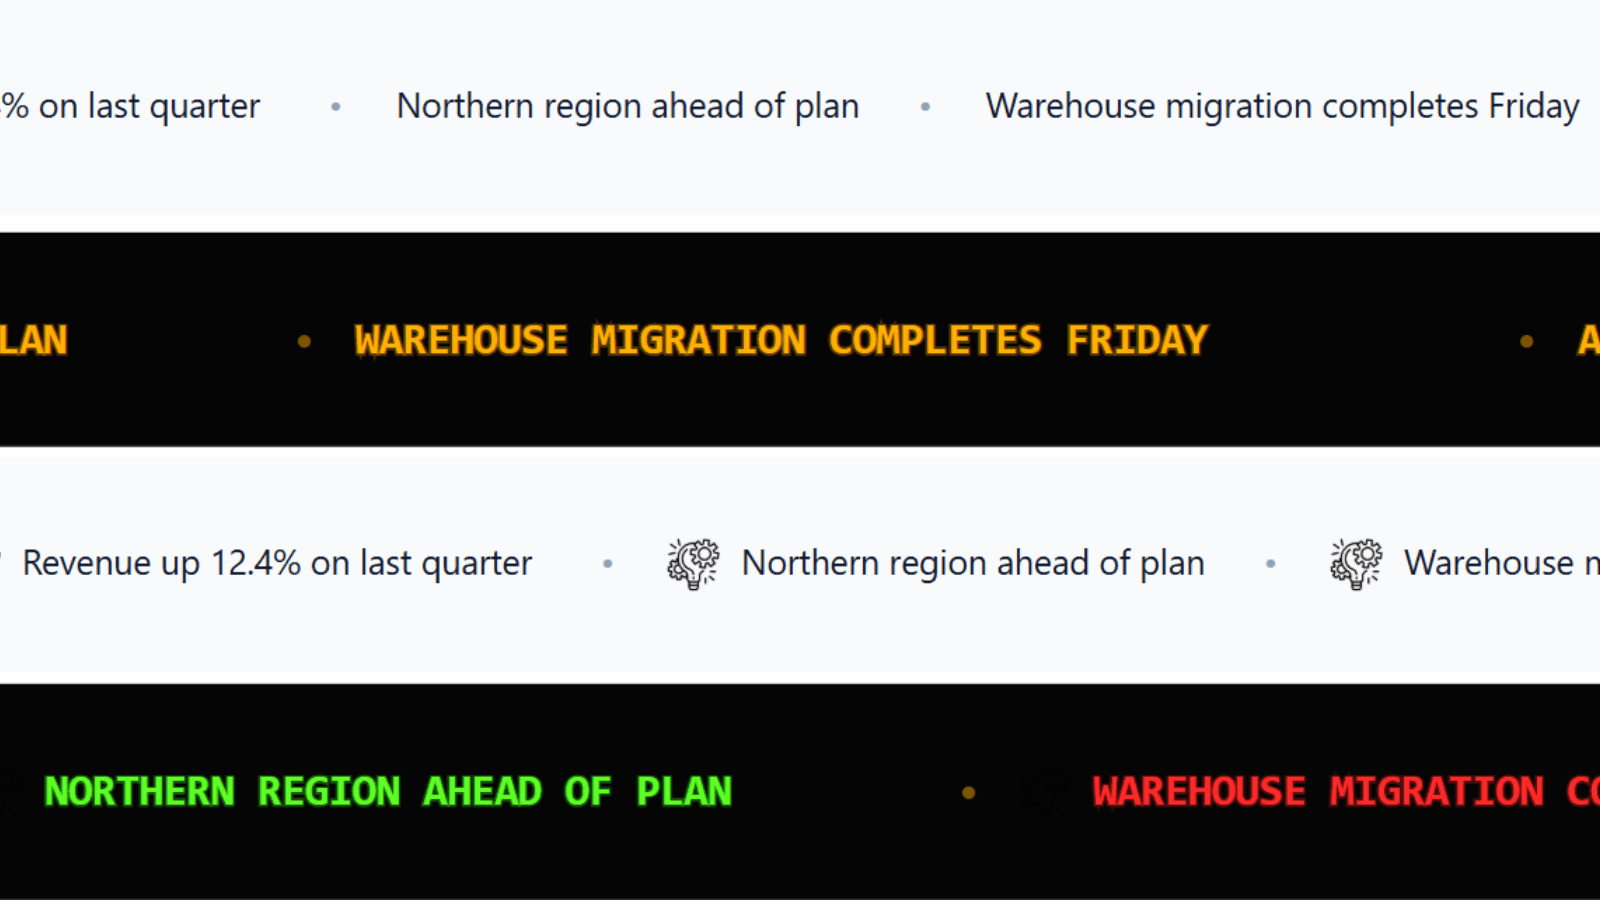
Power Ticker
A scrolling ticker for Power BI — a news-style marquee for announcements, headline figures and partner logos, running in a band across your report.