









How to hide row subtotals and keep the grand total
Keep Row subtotals On and enable Per row level. Expand the row hierarchy, select each unwanted level, and turn its Show subtotal setting Off. Leave the level that preserves the bottom grand total enabled.
Format visual → Visual → Row subtotals → Per row level
Our working setup: Region On · Department Off · Team Off. Follow the steps or see the finished Matrix. No DAX was needed for this layout.
What happened in our native Matrix test
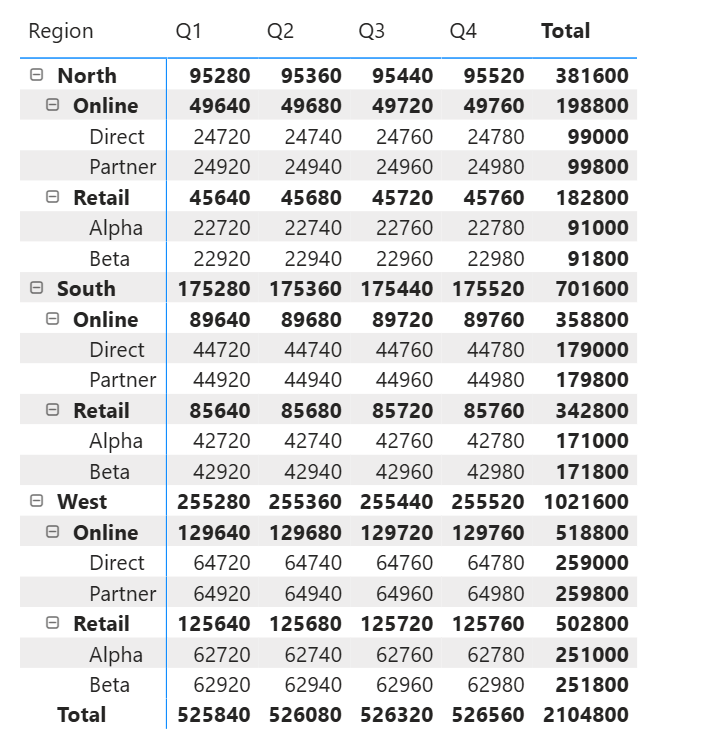
We used Region → Department → Team in Rows and a Year → Quarter hierarchy in Columns. The row labels include North, South and West; Online and Retail; and teams such as Direct and Alpha. With row subtotals enabled, the group rows show aggregated values and an overall Total appears at the bottom.
Reproduce the test: download the CSV and set up your Matrix
Download our synthetic test dataset (CSV). It contains 96 records across three regions, two departments, two teams per department, two years and four quarters. This is the data used for the screenshots, not business data.
- Import through Get data → Text/CSV. Keep Region, Department, Team and Quarter as text; Year, Revenue and Units as whole numbers.
- Add the native Matrix. Put Region → Department → Team in Rows, Year → Quarter in Columns, and Sum of Revenue in Values. Leave Units out of this comparison.
- Expand the row hierarchy through Team. For a consistent Q1–Q4 comparison, use Quarter alone in Columns with both years included, and sort quarters ascending. That gives the same quarter aggregates as the first two captures. Keep the visual size, filters and expansion unchanged while testing the three subtotal configurations.
- Check the starting values: the bottom Total should be 2,104,800; Q1 should total 525,840; North → Online → Direct should show 24,720 in Q1. Then follow the per-level steps below.
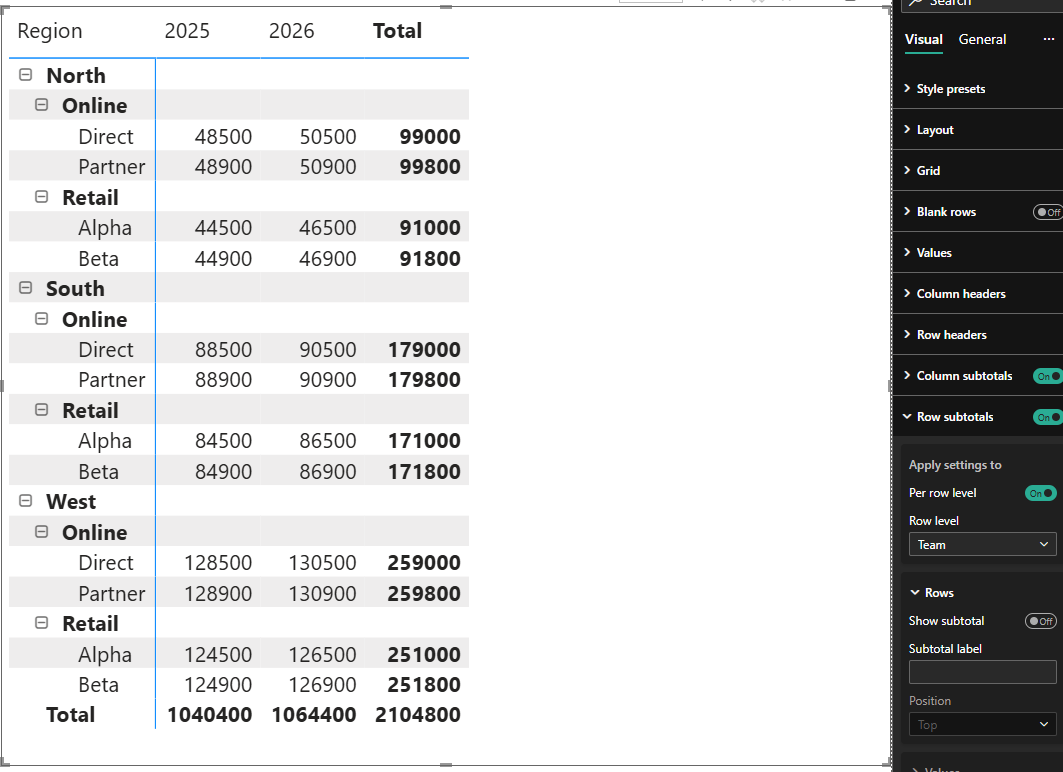
To compare with the final year-level capture, use Year in Columns: 2025 totals 1,040,400 and 2026 totals 1,064,400. Changing the column grouping does not require changing this dataset.
1. Default: subtotals and grand total visible
The obvious switch removes more than expected
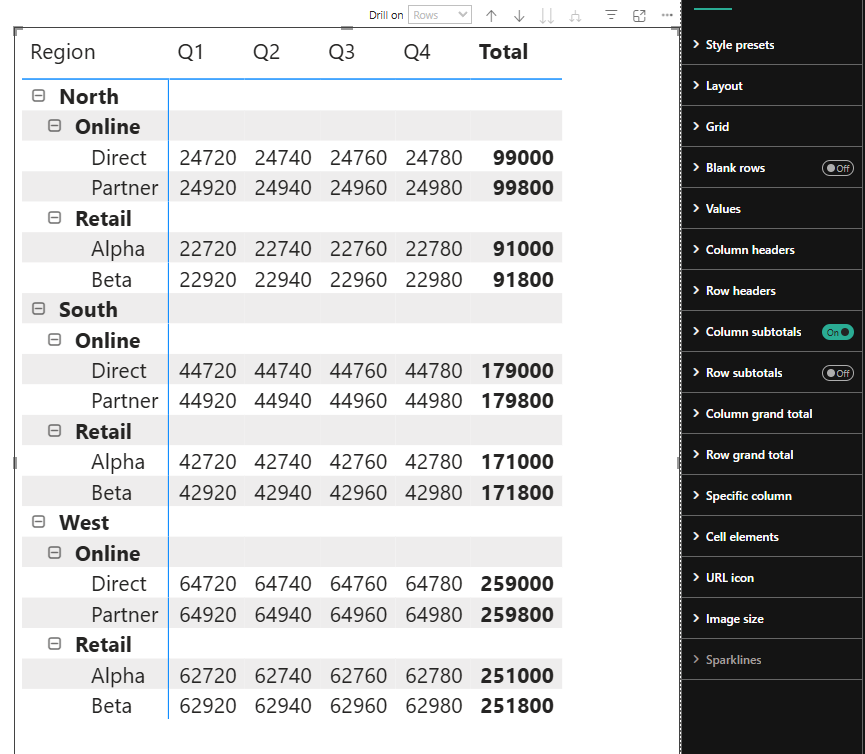
We then switched Row subtotals Off globally. The intermediate subtotal values disappeared, but so did the bottom grand total. The team-level values and the rightmost Total column remained.
2. Global Off: the bottom grand total disappears too
Step by step: keep the grand total without subtotals
Microsoft documents the Per row level, Row level and Show subtotal controls in its Matrix formatting reference. Here is how we used them to get the required result.
Expand the row hierarchy.
Make the Department and Team rows visible before configuring them. Our Row level dropdown initially offered only Region; the other levels appeared after we expanded the visual.
Keep Row subtotals On, then enable Per row level.
Select the Matrix and open Format visual → Visual → Row subtotals. Under Apply settings to, turn Per row level On. Leave the master Row subtotals switch On.
Select each Row level and change Show subtotal.
In our Region → Department → Team hierarchy, we kept Region enabled and disabled Show subtotal for Department and Team. Turning Region off also removed the bottom grand total in our test.
Check the result, then collapse again if needed.
Confirm that the team values and bottom Total remain while the intermediate subtotal values are blank. Our per-level settings persisted after collapsing the hierarchy. With different fields, change one level at a time and check which visible total it controls.
| Row level | Show subtotal | Result in our test |
|---|---|---|
| Region | On | Preserves the bottom Total. |
| Department | Off | Suppresses an intermediate hierarchy total. |
| Team | Off | Suppresses the remaining intermediate subtotal values; team detail stays visible. |
Region On did not mean the North, South and West subtotal values stayed visible. Those values are blank in the finished Matrix, yet leaving Region enabled was necessary to keep the overall bottom Total. In this setup, the Row level name is not a literal “show totals beside this field's labels” switch: judge each setting by the visible result.
These are observations for this hierarchy, not a promise that the field names in every report will control the same visible totals. Check the result after each change.
The finished Matrix: detail and grand total retained
The final screenshot shows Row subtotals On, Per row level On, and Team → Show subtotal Off. The bottom Total is back, while the intermediate group values are blank. This is the result the global Off switch did not give us.
3. Per row level: the grand total stays
Row grand total vs column grand total
A Matrix has totals in two directions. The row grand total is the bottom Total row. The column grand total is the Total column on the right. That is why the right-hand Total can remain after the bottom one disappears.
Two directions, two grand totals
| Team | Q1 | Q2 | Total |
|---|---|---|---|
| Group | Subtotal values hidden | ||
| A | 10 | 20 | 30 |
| B | 30 | 40 | 70 |
| Total | 40 | 60 | 100 |
Bottom row: row grand totalTotals down the rows.
Right column: column grand totalTotals across the columns.
The Format pane gives Row subtotals and Row grand total their own sections, which can make them look like independent visibility switches. Microsoft lists font, text color, background and label styling under Row grand total. That is separate formatting; it does not document an independent show/hide switch there. In our test, visibility still depended on the row-subtotal configuration.
Troubleshooting Matrix subtotals
I turned Row subtotals off and the grand total disappeared.
Turn the master setting back On. Use Per row level to disable the unwanted levels instead. In our test, Region had to remain enabled to preserve the bottom Total.
Why can I only see one field in the Row level dropdown?
Expand the row hierarchy in the visual first. In our test, Department and Team became available only after expansion. Once configured, their settings survived collapsing the Matrix again.
Why are the group labels still there?
Hiding subtotal values does not remove the hierarchy. North, Online and Retail remain as group headings in our finished screenshot. If you need a flat list without those headings, that is a layout requirement, not another subtotal toggle.
Why is the Total column on the right still visible?
That is the column grand total. It totals across the columns, whereas the bottom row totals down the rows. Changing row-subtotal settings does not mean you have changed the column side too.
Can I keep some intermediate subtotals?
Yes. Use the same Per row level controls, but leave the required levels enabled. Check the actual result as you change each selection rather than assuming a field name maps directly to the subtotal label you see.
Which approach do you actually need?
Decision path
Yes
Use the native Matrix
Keep this configuration. You do not need DAX or a custom visual for this layout.
No — what else must change?
Still missing a total? Check the levels first.
Different values by level? Review the measure.
Independent total controls? Consider Ataytis Matrix.
When formatting is not the whole problem
For the layout above, start with formatting. If you want a measure to return different results at different hierarchy levels, that is a calculation requirement instead. For example, you might want a collapsed Region to show a blank measure while Team and the grand total still show values. DAX ISINSCOPE identifies whether a column is the current hierarchy level and can be used in that kind of measure. Returning blank values is not the same as removing hierarchy rows.
A total that looks numerically wrong is another separate issue: by default, Power BI evaluates the measure in the total's filter context rather than simply adding the displayed cells. Averages, ratios and distinct counts may therefore need a different explanation, not a subtotal visibility change. Microsoft also documents custom totals for changing the total calculation. They are not required for the setup in this guide.
When Ataytis Matrix is worth considering
If you only need the layout demonstrated here, the native Matrix can do it. You do not need a custom visual just to hide intermediate subtotal values and keep a final total.
Ataytis Matrix, our custom visual, is useful when you want more explicit control. It exposes row subtotals, column subtotals, row grand totals and column grand totals as separately switchable controls, with subtotal level options and grand-total settings. The totals documentation covers their formatting and sticky behavior.
The trade-off is introducing and licensing a custom visual, subject to your organization's permissions. It makes more sense when those controls solve a recurring reporting need, or when you also need features such as a wider Matrix. See our Power BI Matrix 100-column limit test and workarounds for that separate problem.
Need to find a line item in a long Matrix? Our Matrix search bar guide compares native slicer options with integrated search, including how filtering differs from hiding totals.