
What is the Particle Screen?
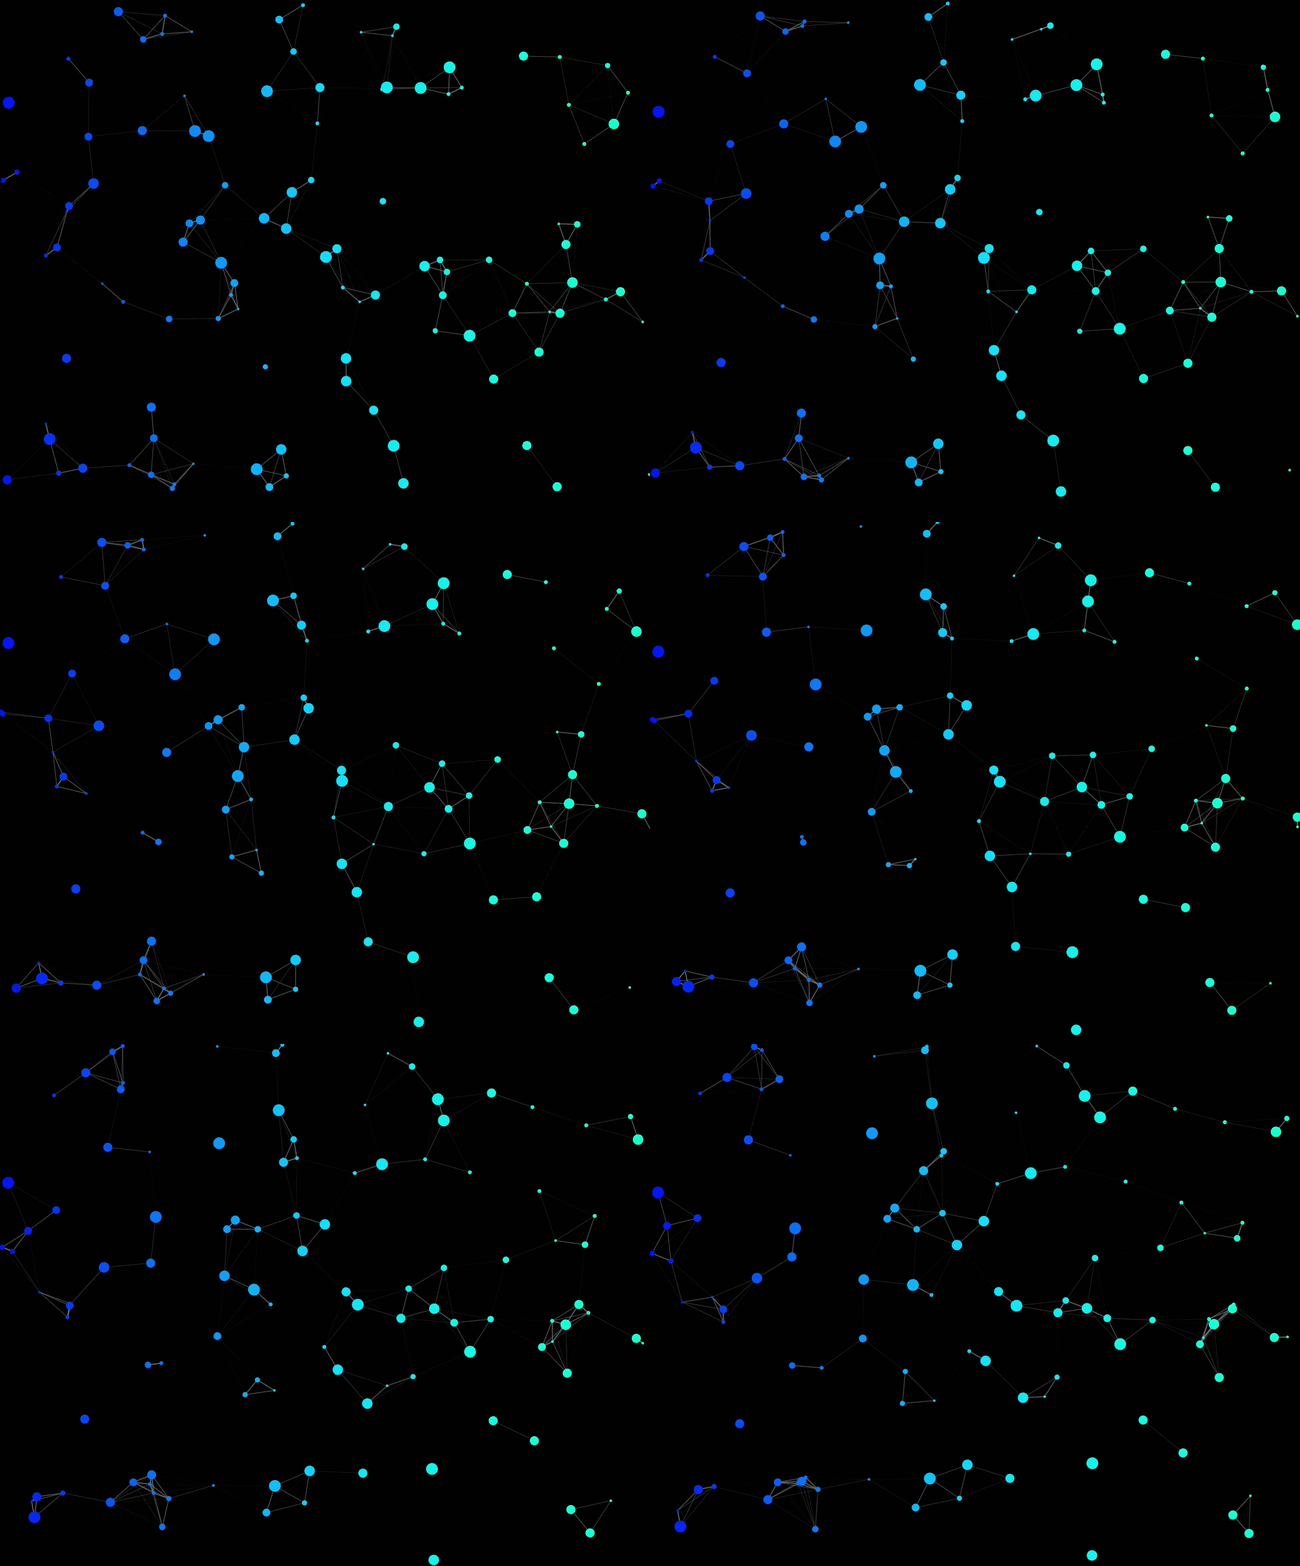
The Particle Screen is a live animated particle network visual for Power BI, built with Deneb and Vega. Particles bounce continuously around the canvas, forming and breaking glowing connection lines as they pass close to each other — all running in real time inside your report.
Like all Deneb visuals, it is delivered as a JSON spec — you paste it straight into the Deneb editor and it is live immediately. Everything about it can be adjusted on the product page using a live interactive preview before you copy anything.
- Continuously animated — particles bounce and connect in real time
- Mouse repulsion — hover to push particles away from your cursor
- Drag interaction — click and drag any individual particle
- Pause / resume — double-click anywhere to freeze and unfreeze
- Colour gradient — particles shift across a spectrum based on position
- No data required — fully self-contained, no fields or measures needed
- Works in Power BI Desktop and Power BI Service
What You'll Need
You only need two things — both free before the visual itself:
Power BI Desktop
Any recent version — free from Microsoft
Deneb custom visual
Free from AppSource — one-time install, covered below
Installing Deneb in Power BI Desktop
Deneb is a free custom visual that lets you run Vega specs inside any Power BI report. You only install it once and it becomes permanently available across all your reports.
- 1Open Power BI Desktop and open any report.
- 2In the Visualisations pane, click the three dots ··· and choose Get more visuals.
- 3Search for Deneb in the AppSource marketplace.
- 4Click Add — the Deneb icon now appears in your Visualisations pane permanently.
Watch: Customise & Paste
The video below shows the full process — tweaking the particle settings on the product page, copying the spec, and pasting it straight into Deneb inside Power BI. It takes well under a minute once Deneb is installed.
Customising the Particle Screen and pasting the spec into Deneb
Adding the Visual to Your Report
Once you have the spec from the product page, the whole process takes about a minute:
- 1Click the Deneb icon in the Visualisations pane to add a Deneb visual to your canvas.
- 2Resize it to the dimensions you want — set the same width and height in the Visual Dimensions controls on the product page so the spec matches.
- 3Click Edit in the visual toolbar to open the Deneb editor.
- 4In the editor, select the Vega tab and delete the placeholder spec that appears by default.
- 5Copy the JSON spec from the Particle Screen product page and paste it in.
- 6Click Apply — the animation starts immediately.
Customising the Visual
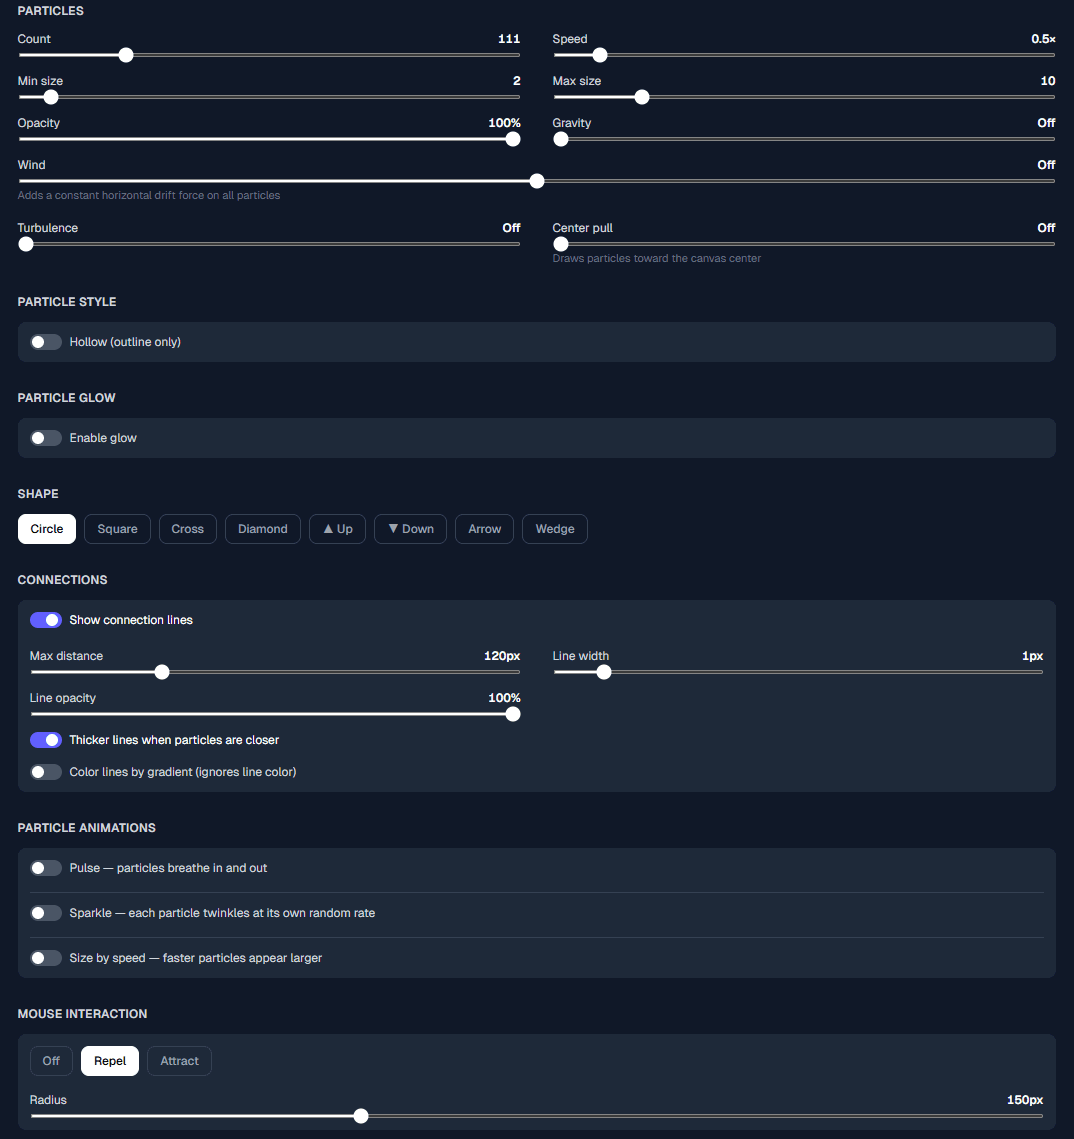
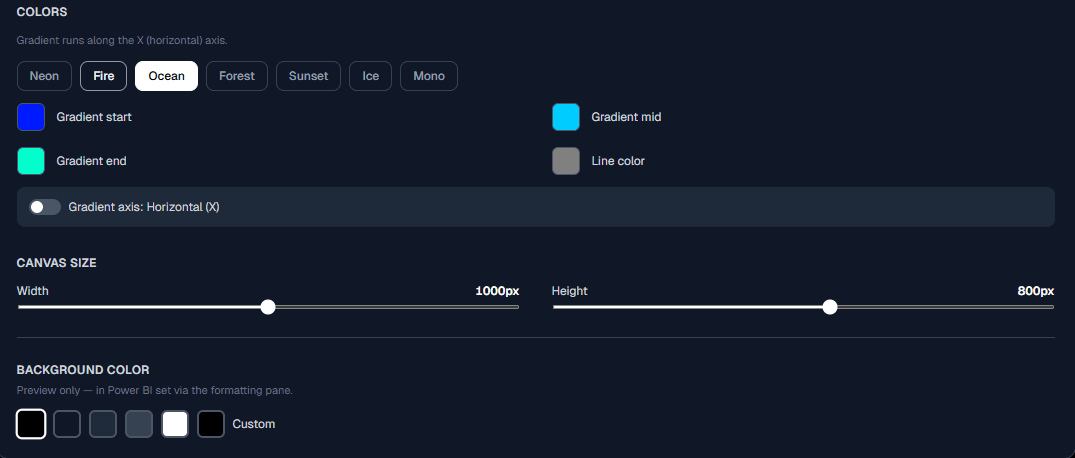
Every aspect of the Particle Screen can be adjusted from the product page — no code, no Deneb editor required. The live preview updates instantly as you move sliders or toggle options. Once it looks right, copy the spec and paste it in.
Particles
- Particle count
- Particle size
- Speed & turbulence
- Stroke style
Connections
- Connection distance
- Line opacity
- Line width
- Colour gradient axis
Interaction
- Mouse repulsion on/off
- Repel radius & strength
- Drag interaction
- Pause on double-click
Canvas
- Width & height (px)
- Background colour
- Wind & gravity
- Centre pull effect
Customisation panel — product page
Mouse repulsion and drag interaction work inside Power BI too — not just in the preview. Once the visual is in your report, viewers can hover to push particles away or click and drag individual ones. Double-click anywhere on the visual to pause, and double-click again to resume.
Using the Visual in Power BI Service
Publish your report as normal and the Particle Screen runs for any viewer in Power BI Service — no gateway, no refresh schedule, no extra configuration. The animation, mouse repulsion, and drag interaction all work in the browser exactly as they do in Power BI Desktop.
✓ Works with
- Power BI Pro
- Premium Per User (PPU)
- Premium capacity workspaces
✕ Not supported on
- Power BI free tier
- Publish to web (anonymous embed)
Ready to add it to your report?
Customise the visual live on the product page, then copy the spec straight into Deneb.
One-time purchase · Instant access · Use in unlimited reports